

Question: Flight Departure Delays The normal quantile plot represents flight departure delay times (minutes) from Data Set 15 in the Appendix: Data Sets. z score 3
Flight Departure Delays The normal quantile plot represents flight departure delay times (minutes) from Data Set 15 in the Appendix: Data Sets.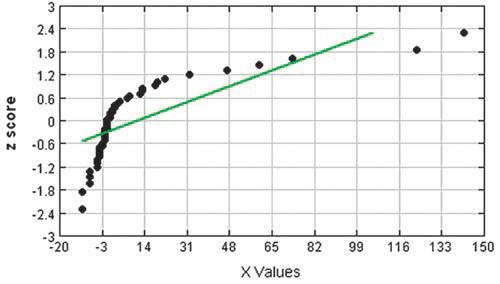
z score 3 2.4 1.8 1.2 0.6 0 -0.6 -1.2 -1.8 -2.4 .3.20 -3 14 31 48 65 X Values 32 82 99 116 133 150
Step by Step Solution
There are 3 Steps involved in it
1 Expert Approved Answer
Step: 1 Unlock

Question Has Been Solved by an Expert!
Get step-by-step solutions from verified subject matter experts
Step: 2 Unlock
Step: 3 Unlock