

Question: Construct a histogram for the data in Exercise 22. Explain how the histogram shows whether it is appropriate to treat this sample as coming from
Construct a histogram for the data in Exercise 22.
Explain how the histogram shows whether it is appropriate to treat this sample as coming from an approximately normal population.
Exercise 22
A manufacturer of aluminum cans measured the level of impurities in 24 cans. The amounts of impurities, in percent, were as follows.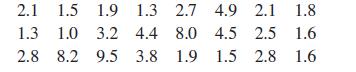
Construct a boxplot for this sample. Is it reasonable to treat the sample as coming from an approximately normal population?
Explain.
2.1 1.5 1.9 1.3 2.7 4.9 2.1 1.8 1.3 1.0 3.2 4.4 8.0 4.5 2.5 1.6 2.8 8.2 9.5 3.8 1.9 1.5 2.8 1.6
Step by Step Solution
★★★★★
3.43 Rating (162 Votes )
There are 3 Steps involved in it
1 Expert Approved Answer
Step: 1 Unlock

Question Has Been Solved by an Expert!
Get step-by-step solutions from verified subject matter experts
Step: 2 Unlock
Step: 3 Unlock