

Question: In 2007, U.S. residents saved approximately $310 billion. In 2015, that amount was $784 billion, about two-and-a-half times greater. Which of the following graphs compares
In 2007, U.S. residents saved approximately $310 billion. In 2015, that amount was $784 billion, about two-and-a-half times greater. Which of the following graphs compares these totals more accurately, and why?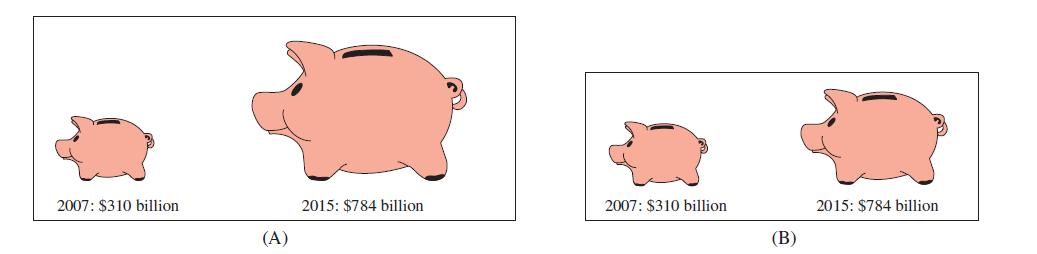
2007: $310 billion 2015: $784 billion 2007: $310 billion 2015: $784 billion (A) (B)
Step by Step Solution
★★★★★
3.49 Rating (152 Votes )
There are 3 Steps involved in it
1 Expert Approved Answer
Step: 1 Unlock

Question Has Been Solved by an Expert!
Get step-by-step solutions from verified subject matter experts
Step: 2 Unlock
Step: 3 Unlock