

Question: The Dow Jones Industrial Average reached its lowest point in recent history on October 9, 2008, when it closed at $8,579. Eight years later, on
The Dow Jones Industrial Average reached its lowest point in recent history on October 9, 2008, when it closed at
$8,579. Eight years later, on October 10, 2016, the average had risen to $18,329.04.
Which of the following graphs accurately represents the magnitude of the increase? Which one exaggerates it?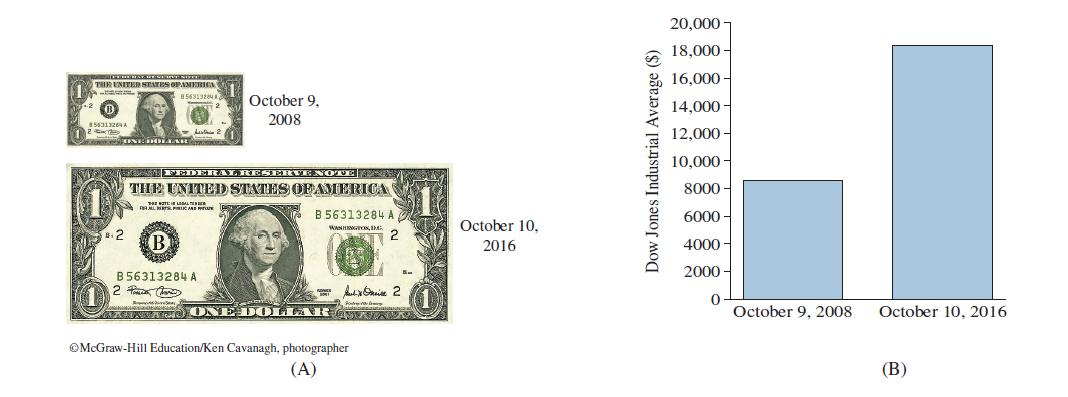
2 THE UNITED STATES OPANERICA B 856313264 A 56313284 JONE DOLLLAR 2 October 9, 2008 FEDERAL RESERVE NOTE THE UNITED STATES OF AMERICA B-2 B B 56313284 A 2 Pawan Chae ONE DOL B 56313284 A WASHINGTON, DC. 2 October 10, 2016 Juli 2 McGraw-Hill Education/Ken Cavanagh, photographer (A) Dow Jones Industrial Average ($) 20,000 18,000- 16,000- 14,000- 12,000- 10,000- 8000- 6000 4000 2000 0 October 9, 2008 October 10, 2016 (B)
Step by Step Solution
3.48 Rating (158 Votes )
There are 3 Steps involved in it

Get step-by-step solutions from verified subject matter experts