

Question: The following bar graph presents the number of hot dogs eaten by the mens and womens winner of Nathans Famous Hot Dog eating championship for
The following bar graph presents the number of hot dogs eaten by the men’s and women’s winner of Nathan’s Famous Hot Dog eating championship for the years 2011–2016. Does the graph present an accurate picture of the difference between the men’s and women’s winners? Or is it misleading? Explain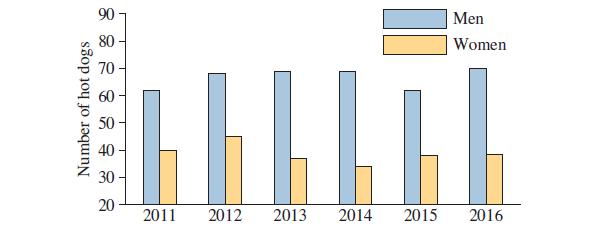
Number of hot dogs 90 80 Men Women 50 40 30 882888 2 60 20 2011 2012 2013 2014 2015 2016
Step by Step Solution
★★★★★
3.37 Rating (172 Votes )
There are 3 Steps involved in it
1 Expert Approved Answer
Step: 1 Unlock

Question Has Been Solved by an Expert!
Get step-by-step solutions from verified subject matter experts
Step: 2 Unlock
Step: 3 Unlock