

The following frequency distribution presents the number of households (in thousands) categorized by the language spoken at
Question:
The following frequency distribution presents the number of households (in thousands) categorized by the language spoken at home, for the cities of New York and Los Angeles in the year 2009. The Total column presents the numbers of households in both cities combined.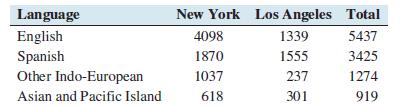
a. Construct a frequency bar graph for each city.
b. Construct a frequency bar graph for the total.
c. Construct a relative frequency bar graph for each city.
d. Construct a relative frequency bar graph for the total.
e. Explain why the heights of the bars for the frequency bar graph for the total are equal to the sums of the heights for the individual cities.
f. Explain why the heights of the bars for the relative frequency bar graph for the total are not equal to the sums of the heights for the individual cities.
Step by Step Answer:

This question has not been answered yet.
You can Ask your question!


