

Twenty college students were sampled after their freshman year. Following are their freshman GPAs, their high school
Question:
Twenty college students were sampled after their freshman year. Following are their freshman GPAs, their high school GPAs, their SAT reading scores, and their SAT math scores.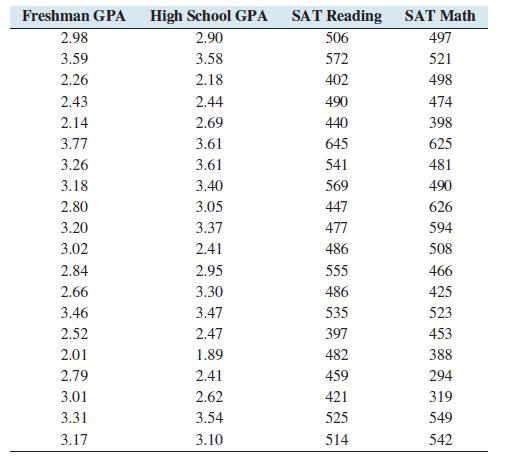
a. Let y represent freshman GPA, x1 represent high school GPA, x2 represent SAT reading score, and x3 represent SAT math score, Construct the multiple regression equation ̂y = b0 + b1x1 + b2x2 + b3x3.
b. An applicant for next year’s freshman class has a high school GPA of 3.05, an SAT reading score of 510, and an SAT math score of 515.
Predict the freshman GPA for this student.
c. Refer to part (b). Construct a 95% confidence interval for the freshman GPA.
d. Refer to part (b). Construct a 95% prediction interval for the freshman GPA.
e. What percentage of the variation in freshman GPA is explained by the model?
f. Is the model useful for prediction? Why or why not? Use the α = 0.01 level.
g. Test H0: β1 = 0 versus H1: β1 ≠ 0 at the α = 0.05 level. Can you reject H0? Repeat for β2 and β3.
Step by Step Answer:


