

Question: Using the data in Exercise 30: a. Construct a frequency polygon for the frequency distribution. b. Construct a relative frequency polygon, using the same classes.
Using the data in Exercise 30:
a. Construct a frequency polygon for the frequency distribution.
b. Construct a relative frequency polygon, using the same classes.
Exercise 30
The following frequency distribution presents the number of murders (including negligent manslaughter) per 100,000 population for each U.S. city with population over 250,000 in a recent year.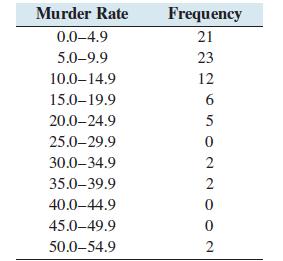
Murder Rate Frequency 0.0-4.9 21 5.0-9.9 23 10.0-14.9 12 15.0-19.9 6 20.0-24.9 5 25.0-29.9 30.0-34.9 35.0-39.9 40.0-44.9 45.0-49.9 50.0-54.9 022002
Step by Step Solution
There are 3 Steps involved in it
1 Expert Approved Answer
Step: 1 Unlock

Question Has Been Solved by an Expert!
Get step-by-step solutions from verified subject matter experts
Step: 2 Unlock
Step: 3 Unlock