

Question: Using the data in Exercise 3.5, construct a frequency distribution. a. Determine the approximate values of the mean and standard deviation. b. Compare the approximate
Using the data in Exercise 3.5, construct a frequency distribution.
a. Determine the approximate values of the mean and standard deviation.
b. Compare the approximate values from part (a) with the actual values.
c. Construct a frequency distribution with twice as many classes as before, then repeat parts (a) and (b). Have the approximations improved?
d. If you were to construct a “frequency distribution” in which each data value was at the midpoint of its own class, what values do you think the “approximations” would have? Explain.
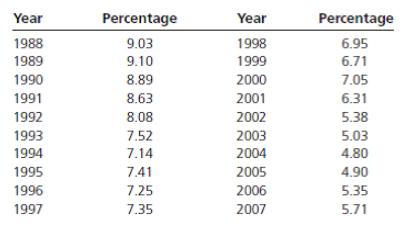
Year Percentage Year Percentage 1988 9.03 1998 6.95 1989 9.10 1999 6.71 1990 8.89 2000 7.05 1991 8.63 2001 6.31 1992 8.08 2002 5.38 1993 7.52 2003 5.03 1994 7.14 2004 4.80 1995 7.41 2005 4.90 1996 7.25 2006 5.35 1997 7.35 2007 5.71
Step by Step Solution
3.40 Rating (178 Votes )
There are 3 Steps involved in it
a Frequency distribution with classes having widths of 1 class m i f i f i m i f i m i 2 4 under 5 4... View full answer

Get step-by-step solutions from verified subject matter experts
Document Format (1 attachment)
522-M-S-D-A (3639).docx
120 KBs Word File