

Question: Using the data in Table 2.7, construct a frequency distribution with classes of width 0.5. Table 2.7 Particulate Emissions for 65 Vehicles 1.50 0.87 1.12
Using the data in Table 2.7, construct a frequency distribution with classes of width 0.5.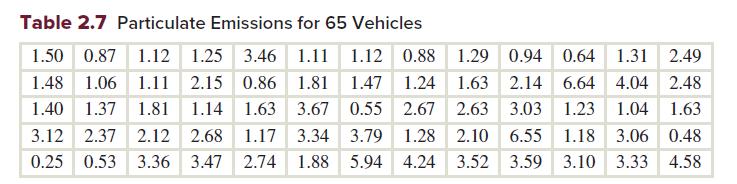
Table 2.7 Particulate Emissions for 65 Vehicles 1.50 0.87 1.12 1.25 3.46 1.11 1.12 0.88 1.29 0.94 0.64 1.31 2.49 1.48 1.06 1.11 2.15 0.86 1.81 1.47 1.24 1.63 2.14 6.64 4.04 2.48 1.40 1.37 1.81 1.14 1.63 3.67 0.55 2.67 2.63 3.03 1.23 1.04 1.63 3.12 2.37 2.12 2.68 3.34 3.79 1.28 2.10 6.55 1.18 3.06 0.48 1.88 5.94 4.24 3.52 3.59 3.10 3.33 4.58 0.25 0.53 3.36 3.47 1.17 2.74
Step by Step Solution
★★★★★
3.34 Rating (151 Votes )
There are 3 Steps involved in it
1 Expert Approved Answer
Step: 1 Unlock

Question Has Been Solved by an Expert!
Get step-by-step solutions from verified subject matter experts
Step: 2 Unlock
Step: 3 Unlock