

Question: The following table presents a frequency distribution for the number of cars and light trucks sold in a recent month. a. Construct a bar graph.
The following table presents a frequency distribution for the number of cars and light trucks sold in a recent month.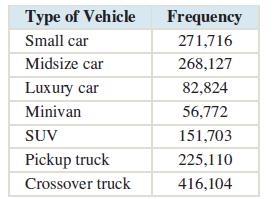
a. Construct a bar graph.
b. Construct a relative frequency distribution.
c. Construct a relative frequency bar graph.
d. Construct a pie chart.
Type of Vehicle Frequency Small car 271,716 Midsize car 268,127 Luxury car 82,824 Minivan 56,772 SUV 151,703 Pickup truck 225,110 Crossover truck 416,104
Step by Step Solution
★★★★★
3.34 Rating (145 Votes )
There are 3 Steps involved in it
1 Expert Approved Answer
Step: 1 Unlock

Question Has Been Solved by an Expert!
Get step-by-step solutions from verified subject matter experts
Step: 2 Unlock
Step: 3 Unlock