New Semester
Started
Get
50% OFF
Study Help!
--h --m --s
Claim Now
Question Answers
Textbooks
Find textbooks, questions and answers
Oops, something went wrong!
Change your search query and then try again
S
Books
FREE
Study Help
Expert Questions
Accounting
General Management
Mathematics
Finance
Organizational Behaviour
Law
Physics
Operating System
Management Leadership
Sociology
Programming
Marketing
Database
Computer Network
Economics
Textbooks Solutions
Accounting
Managerial Accounting
Management Leadership
Cost Accounting
Statistics
Business Law
Corporate Finance
Finance
Economics
Auditing
Tutors
Online Tutors
Find a Tutor
Hire a Tutor
Become a Tutor
AI Tutor
AI Study Planner
NEW
Sell Books
Search
Search
Sign In
Register
study help
engineering
design and analysis of experiments
Design And Analysis Of Experiments 5th Edition Douglas C., Montgomery - Solutions
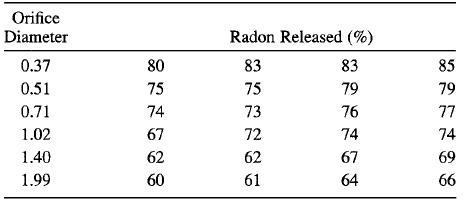
An article in Environment International (Vol. 18, No. 4, 1992) describes an experiment in which the amount of radon released in showers was investigated. Radon-enriched water was used in the experiment, and six different orifice diameters were tested in shower heads. The data from the experiment
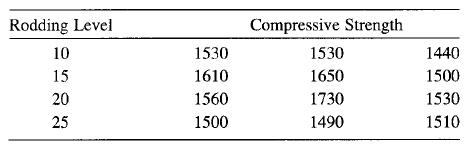
An article in the ACI Materials Journal (Vol. 84,1987, pp. 213-216) describes several experiments investigating the rodding of concrete to remove entrapped air. A 3-inch × 6-inch cylinder was used, and the number of times this rod was used is the design variable. The resulting compressive strength
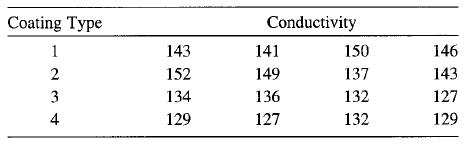
Reconsider the experiment from Problem 3-6. Analyze the residuals and draw conclusions about model adequacy.Problem 3-6.A manufacturer of television sets is interested in the effect on tube conductivity of four different types of coating for color picture tubes. The following conductivity data are
A manufacturer of television sets is interested in the effect on tube conductivity of four different types of coating for color picture tubes. The following conductivity data are obtained:(a) Is there a difference in conductivity due to coating type? Use α = 0.05.(b) Estimate the overall mean and
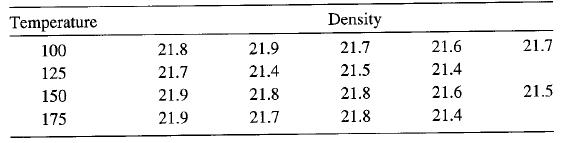
Rework part (d) of Problem 3-4 using the Fisher LSD method. What conclusions can you draw? Explain carefully how you modified the technique to account for unequal sample sizes.Problem 3-4An experiment was run to determine whether four specific firing temperatures affect me density of a certain type
An experiment was run to determine whether four specific firing temperatures affect me density of a certain type of brick. The experiment led to the following data: (a) Does the firing temperature affect the density of the bricks? Use α = 0.05.(b) Is it appropriate to compare the means using
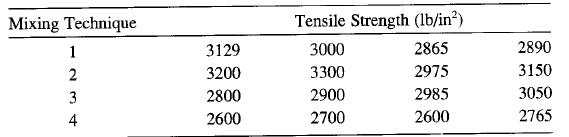
Reconsider the experiment in Problem 3-1. Find a 95 percent confidence interval on the mean tensile strength of the portland cement produced by each of the four mixing techniques. Also find a 95 percent confidence interval on the difference in means for techniques 1 and 3. Does this aid you in
(a) Rework part (b) of Problem 3-1 using Duncan's multiple range test with α = 0.05. Does this make any difference in your conclusions?(b) Rework part (b) of Problem 3-1 using Tukey's test with α = 0.05. Do you get the same conclusions from Tukey's test that you did from the graphical procedure
The tensile strength of portland cement is being studied. Four different mixing techniques can be used economically. The following data have been collected: (a) Test the hypothesis that mixing techniques affect the strength of the cement. Use α = 0.05.(b) Construct a graphical display as
Construct a data set for which the paired t-test statistic is very large, but for which the usual two-sample or pooled t-test statistic is small. In general, describe how you created the data. Does this give you any insight regarding how the paired t-test works?
Develop an equation for finding a 100(1 – α) percent confidence interval on the difference in the means of two normal distributions where σ21 ≠ σ22. Apply your equation to the portland cement experiment data, and find a 95 percent confidence interval.
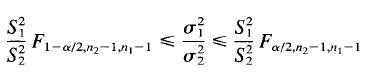
Develop Equation 2-50 for a 100(1 – α) percent confidence interval for the ratio σ21/σ21 where σ21 and σ22 are the variances of two normal distributions.Equation 2-50 Fa/2,n2-11-1 F1 -a/2,n2-1-1 VI
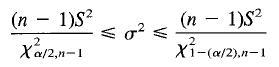
Develop Equation 2-46 for a 100(1 – α) percent confidence interval for the variance of a normal distribution.Equation 2-46 (п — 1)52 (п — 1)5? < o? < ,2 2 Xi-(a/2).n-1
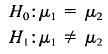
Suppose we are testing where σ21 and σ22 are known. Our sampling resources are constrained such that n1 + n2 = N. How should we allocate the N observations between the two populations to obtain the most powerful test? Но:
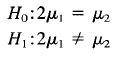
Two popular pain medications are being compared on the basis of the speed of absorption by the body. Specifically, tablet 1 is claimed to be absorbed twice as fast as tablet 2. Assume that σ21 and σ22 are known. Develop a test statistic for Ho:2µ, %3D H:2µ1 + 2
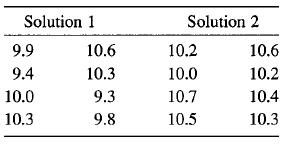
In semiconductor manufacturing wet chemical etching is often used to remove silicon from the backs of wafers prior to metalization. The etch rate is an important characteristic of this process. Two different etching solutions are being evaluated. Eight randomly selected wafers have been etched in
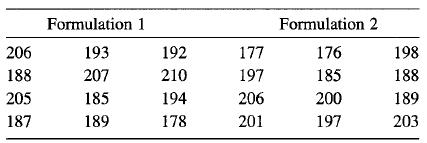
Refer to the data in Problem 2-17. Do the data support a claim that the mean deflection temperature under load for formulation 1 exceeds that of formulation 2 by at least 3°F?Problem 2-17.The deflection temperature under load for two different formulations of ABS plastic pipe is being studied. Two
The deflection temperature under load for two different formulations of ABS plastic pipe is being studied. Two samples of 12 observations each are prepared using each formulation and the deflection temperatures (in °F) are reported below: (a) Construct normal probability plots for both
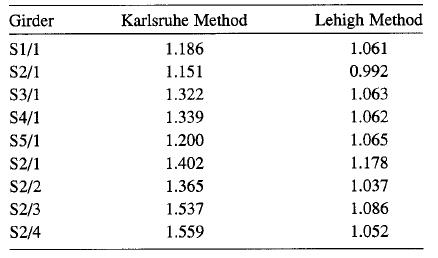
An article in the Journal of Swain Analysis (vol. 18, no. 2, 1983) compares several pro-cedures for predicting the shear strength for steel plate girders. Data for nine girders in the form of the ratio of predicted to observed load for two of these procedures, the Karls-ruhe and Lehigh methods, are
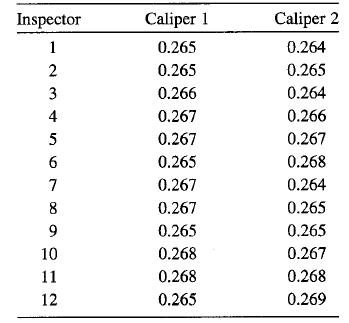
The diameter of a ball bearing was measured by 12 inspectors, each using two different kinds of calipers. The results were (a) Is there a significant difference between the means of the population of measurements from which the two samples were selected? Use α = 0.05.(b) Find the P-value for
Twenty observations on etch uniformity on silicon wafers are taken during a qualification experiment for a plasma etcher. The data are as follows: (a) Construct a 95 percent confidence interval estimate of σ2.(b) Test the hypothesis that σ2 = 1.0. Use α = 0.05. What are your
A new filtering device is installed in a chemical unit. Before its installation, a random sample yielded the following information about the percentage of impurity: y̅1 = 12.5, S21 = 101.17, and n1 = 8. After installation, a random sample yielded y̅2 = 10.2, S22= 94.73, n2 = 9.(a) Can you
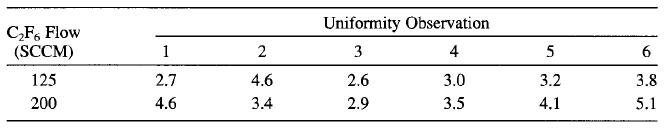
An article in Solid State Technology, "Orthogonal Design for Process Optimization and Its Application to Plasma Etching" by G. Z. Yin and D. W. Jillie (May, 1987) describes an experiment to determine the effect of the C2F6 flow rate on the uniformity of the etch on a silicon wafer used in
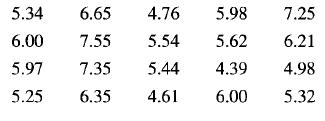
The following are the burning times of chemical flares of two different formulations. The design engineers are interested in both the mean and variance of the burning times. (a) Test the hypothesis that the two variances are equal. Use α = 0.05.(b) Using the results of (a), test the
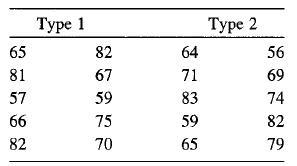
Two types of plastic are suitable for use by an electronic calculator manufacturer. The breaking strength of this plastic is important. It is known that σ1, = σ2 = 1.0 psi. From random samples of n1 = 10 and n2 = 12 we obtain y̅1 = 1623 and y̅2 = 155.0. The company will not adopt plastic 1
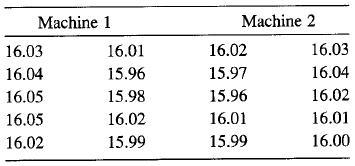
Two machines are used for filling plastic bottles with a net volume of 16.0 ounces. The filling processes can be assumed to be normal, with standard deviations of σ1 = 0.015 and σ2 = 0.018. The quality engineering department suspects that both machines fill to the same net volume, whether or not
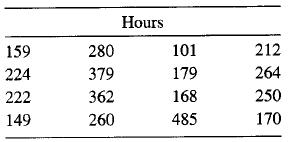
Reconsider the repair time data in Problem 2-7. Can repair time, in your opinion, be adequately modeled by a normal distribution?Problem 2-7The time to repair an electronic instrument is a normally distributed random variable measured in hours. The repair times for 16 such instruments chosen at
The time to repair an electronic instrument is a normally distributed random variable measured in hours. The repair times for 16 such instruments chosen at random are as follows: (a) You wish to know if the mean repair time exceeds 225 hours. Set up appropriate hypotheses for investigating
Consider the shelf life data in Problem 2-5. Can shelf life be described or modeled adequately by a normal distribution? What effect would violation of this assumption have on the test procedure you used in solving Problem 2-5?Problem 2-5The shelf life of a carbonated beverage is of interest. Ten
The shelf life of a carbonated beverage is of interest. Ten bottles are randomly selected and tested, and the following results are obtained:Days108138124163124159106134115139(a) We would like to demonstrate that the mean shelf life exceeds 120 days. Set up appropriate hypotheses for investigating
A normally distributed random variable has an unknown mean p, and a known variance σ2 = 9. Find the sample size required to construct a 95 percent confidence interval on the mean that has total width of 1.0.
The diameters of steel shafts produced by a certain manufacturing process should have a mean diameter of 0.255 inches. The diameter is known to have a standard deviation of σ = 0.0001 inch. A random sample of 10 shafts has an average diameter of 0.2545 inch.(a) Set up appropriate hypotheses on the
The viscosity of a liquid detergent is supposed to average 800 centistokes at 25°C. A random sample of 16 batches of detergent is collected, and the average viscosity is 812. Suppose we know that the standard deviation of viscosity is α = 25 centistokes.(a) State the hypotheses that should be
The breaking strength of a fiber is required to be at least 150 psi. Past experience has indicated that the standard deviation of breaking strength is σ = 3 psi.A random sample of four specimens is tested, and the results are y1 = 145, y2 = 153, y3 = 150, and y4, = 147.(a) State the hypotheses
The breaking strength of a fiber is required to be at least 150 psi. Past experience has indicated that the standard deviation of breaking strength is σ = 3 psi.A random sample of four specimens is tested, and the results are y1 = 145, y2 = 153, y3 = 150, and y4, = 147.(a) State the hypotheses
The diameters of steel shafts produced by a certain manufacturing process should have a mean diameter of 0.255 inches. The diameter is known to have a standard deviation of σ = 0.0001 inch. A random sample of 10 shafts has an average diameter of 0.2545 inch.(a) Set up appropriate hypotheses on the
The breaking strength of a fiber is required to be at least 150 psi. Past experience has indicated that the standard deviation of breaking strength is σ = 3 psi.A random sample of four specimens is tested, and the results are y1 = 145, y2 = 153, y3 = 150, and y4, = 147.(a) State the hypotheses
The breaking strength of a fiber is required to be at least 150 psi. Past experience has indicated that the standard deviation of breaking strength is σ = 3 psi.A random sample of four specimens is tested, and the results are y1 = 145, y2 = 153, y3 = 150, and y4, = 147.(a) State the hypotheses
The breaking strength of a fiber is required to be at least 150 psi. Past experience has indicated that the standard deviation of breaking strength is σ = 3 psi.A random sample of four specimens is tested, and the results are y1 = 145, y2 = 153, y3 = 150, and y4, = 147.(a) State the hypotheses
The breaking strength of a fiber is required to be at least 150 psi. Past experience has indicated that the standard deviation of breaking strength is σ = 3 psi.A random sample of four specimens is tested, and the results are y1 = 145, y2 = 153, y3 = 150, and y4, = 147.(a) State the hypotheses
Showing 300 - 400
of 340
1
2
3
4
Step by Step Answers