New Semester
Started
Get
50% OFF
Study Help!
--h --m --s
Claim Now
Question Answers
Textbooks
Find textbooks, questions and answers
Oops, something went wrong!
Change your search query and then try again
S
Books
FREE
Study Help
Expert Questions
Accounting
General Management
Mathematics
Finance
Organizational Behaviour
Law
Physics
Operating System
Management Leadership
Sociology
Programming
Marketing
Database
Computer Network
Economics
Textbooks Solutions
Accounting
Managerial Accounting
Management Leadership
Cost Accounting
Statistics
Business Law
Corporate Finance
Finance
Economics
Auditing
Tutors
Online Tutors
Find a Tutor
Hire a Tutor
Become a Tutor
AI Tutor
AI Study Planner
NEW
Sell Books
Search
Search
Sign In
Register
study help
engineering
design and analysis of experiments
Design And Analysis Of Experiments 5th Edition Douglas C., Montgomery - Solutions
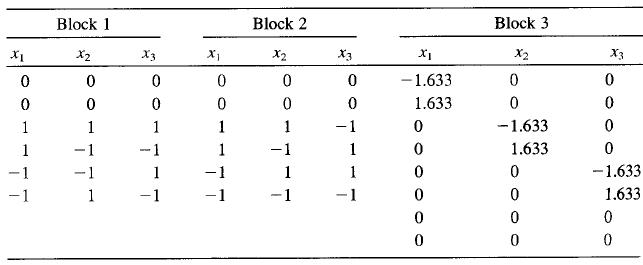
Verify that the central composite design shown below blocks orthogonally: Block 1 Block 2 Block 3 X2 X3 X2 X3 X2 X3 -1.633 1.633 1 1 1 1 1 -1 -1.633 1 1 1 -1 1 1.633 -1 -1 1 1 -1.633 1 -1 -1 -1 1.633
The rotatable central composite design. It can be shown that a second-order design is rotatable if if a or b (or both) are odd and ifShow that for the central composite design these conditions lead to α = (nF)1/4' for rotatability, where nF. is the number of points in the
Show that augmenting a 2k design with n, center points does not affect the estimates of the βi (i = 1, 2, ..., k) but that the estimate of the intercept β° is the average of all + n, observations.
Verify that an orthogonal first-order design is also first-order rotatable.
A central composite design is run in a chemical vapor deposition process, resulting in the experimental data shown on the next page. Four experimental units were processed simultaneously on each run of the design, and the responses are the mean and variance of thickness, computed across the four
A manufacturer of cutting tools has developed two empirical equations for tool life in hours (y1) and for tool cost in dollars (y2). Both models are linear functions of steel hardness (x1) and manufacturing time (x2). The two equations are ŷ1 = 10 + 5x1 + 2x2ŷ2 = 23 + 3x1 + 4x2 and
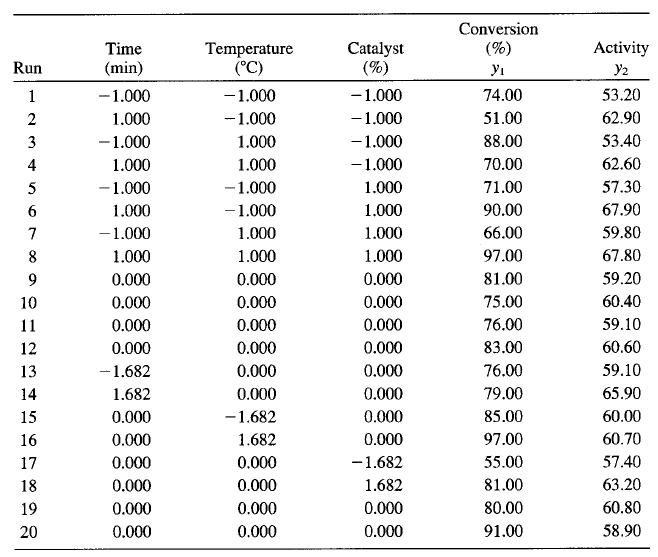
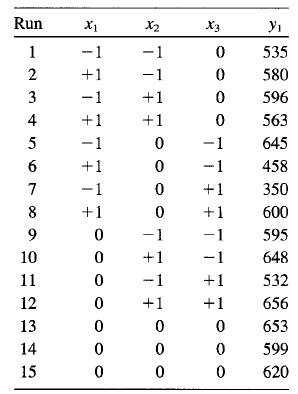
Consider the three-variable central composite design shown below. Analyze the data and draw conclusions, assuming that we wish to maximize conversion (y1) with activity (y2) between 55 and 60. Conversion Temperature (°C) Time (%) Activity Catalyst (%) Run (min) yı Y2 1 -1.000 -1.000 -1.000
An experimenter has run a Box-Behnken design and has obtained the results below, where the response variable is the viscosity of a polymer: (a) Fit the second-order model.(b) Perform the canonical analysis. What type of surface has been found? (c) What operating conditions on x1, x2, and
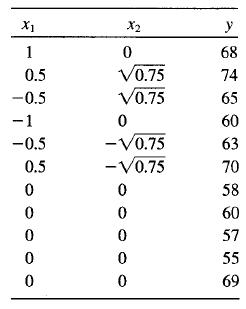
The hexagon design that follows is used in an experiment that has the objective of fitting a second-order model: (a) Fit the second-order model.(b) Perform the canonical analysis. What type of surface has been found?(c) What operating conditions on x1 and x2 lead to the stationary
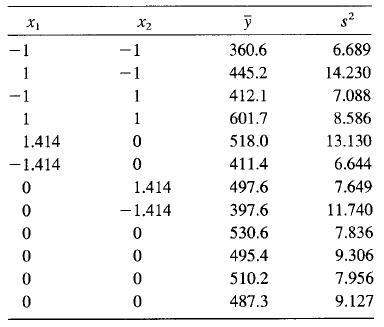
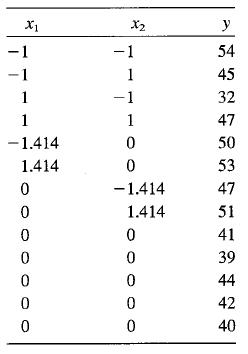
The following data were collected by a chemical engineer. The response y is filtration time, x1 is temperature, and x2 is pressure. Fit a second-order model. (a) What operating conditions would you recommend if the objective is to minimize the filtration time?(b) What operating
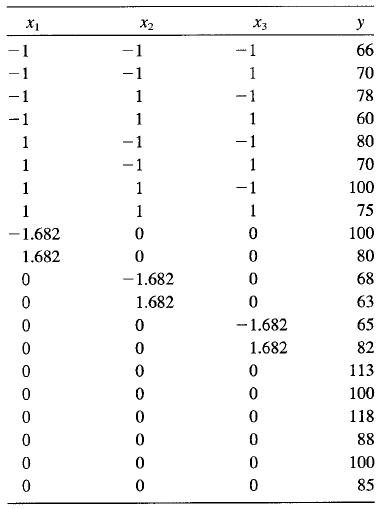
The data shown in the following table were collected in an experiment to optimize crystal growth as a function of three variables x1, x2, and x3. Large values of y (yield in grams) are desirable. Fit a second-order model and analyze the fitted surface. Under what set of conditions is maximum growth
The path of steepest ascent is usually computed assuming that the model is truly first-order, that is, there is no interaction. However, even if there is interaction, steepest ascent ignoring the interaction still usually produces good results. To illustrate, suppose that we have fit the
The region of experimentation for two factors are temperature (100 ≤ T ≤ 300°F) and catalyst feed rate (10 ≤ C ≤ 30 lb/in). A first-order model in the usual ± 1 coded variables has been fit to a molecular weight response, yielding the following model:ŷ= 2000 + 125x1 + 40x2(a) Find
For the first-order model ŷ= 60 + 1.5x1 - 0.8x2 + 2.0x3find the path of steepest ascent. The variables are coded as -1 ≤ xi ≤ 1.
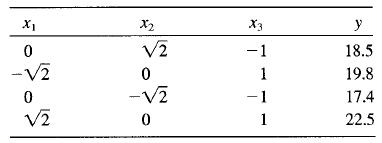
Verify that the following design is a simplex. Fit the first-order model, and find the path of steepest ascent. X1 X2 X3 y -1 18.5 -V2 1 19.8 -V2 -1 17.4 1 22.5
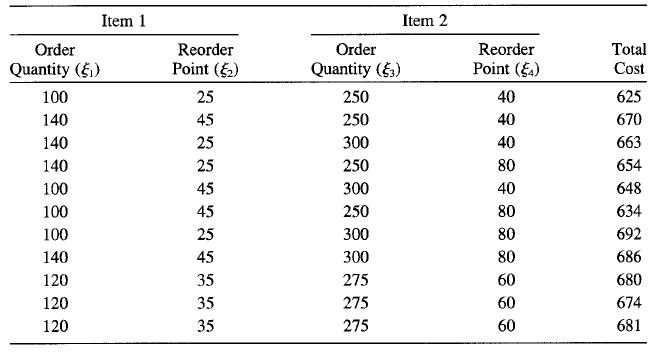
An industrial engineer has developed a computer simulation model of a two-item inventory system. The decision variables are the order quantity and the reorder point for each item. The response to be minimized is total inventory cost. The simulation model is used to produce the data shown in the
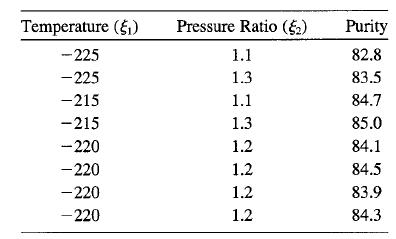
A chemical plant produces oxygen by liquifying air and separating it into its component gases by fractional distillation. The purity of the oxygen is a function of the main con-denser temperature and the pressure ratio between the upper and lower columns. Current operating conditions are
Consider the 24-1IV design discussed in Example 10-5.(a) Suppose you elect to augment the design with the single run selected in that ex-ample. Find the variances and covariances of the regression coefficients in the model (ignoring blocks): (b) Are there any other runs in the alternate
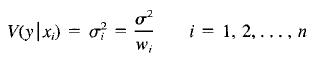
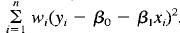
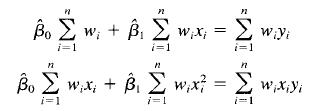
Suppose that we are fitting the straight line y = β0 + β1x + ∈, but the variance of the y's now depends on the level of x; that is, where the w, are known constants, often called weights. Show that if we choose estimates of the regression coefficients to minimize the weighted sum of
Suppose that we are fitting a straight line and we desire to make the variance of A as small as possible. Restricting ourselves to an even number of experimental points, where should we place these points so as to minimize V(β̂1)? Use the design called for in this exercise with great caution
Any analysis of variance model can be expressed in terms of the general linear model y = xβ + ∈, where the X matrix consists of 0s and 1s. Show that the single-factor model yij = µ + τi, ∈ij, i = 1, 2, 3, 4 can be written in general linear model form. Then(a) Write the normal
After you have fit the model, test for significance of regression.(a) Consider the quadratic regression model from Problem 10-12. Compute t statistics for each model parameter and comment on the conclusions that follow from these quantities.(b) Use the extra sum of squares method to evaluate the
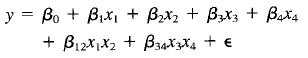
Given the following data, fit the second-order polynomial regression modelAfter you have fit the model, test for significance of regression. y = Bo + Bix, + B,x2 + Buxỉ + B2zx3 + B12x1X2 +e
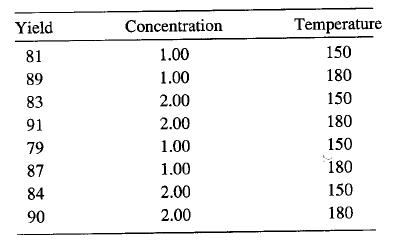
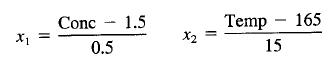
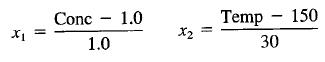
The yield of a chemical process is related to the concentration of the reactant and the operating temperature. An experiment has been conducted with the following results.The yield of a chemical process is related to the concentration of the reactant and the operating temperature. An experiment has
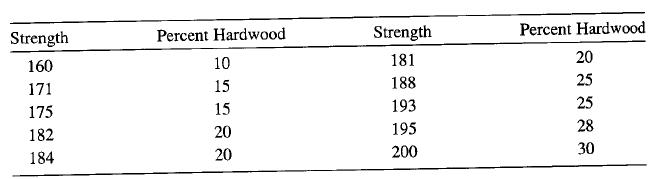
Using the results of Problem 10-1, test the regression model for lack of fit.Problem 10-1The tensile strength of a paper product is related to the amount of hardwood in the pulp. Ten samples are produced in the pilot plant, and the data obtained are shown in the following table. Percent
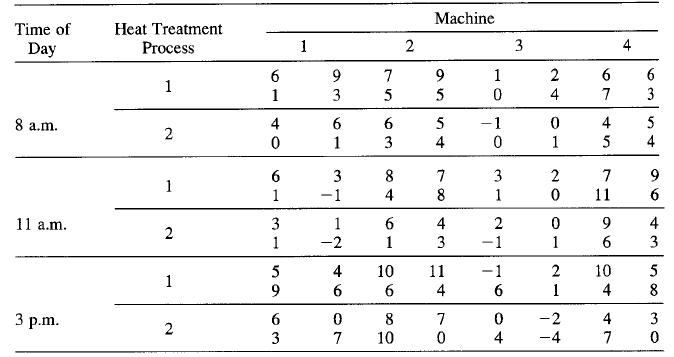
An article by W. D. Baten in the 1956 volume of Industrial Quality Control described an experiment to study the effect of three factors on the lengths of steel bars. Each bar was subjected to one of two heat treatment processes and was cut on one of four machines at one of three times during the
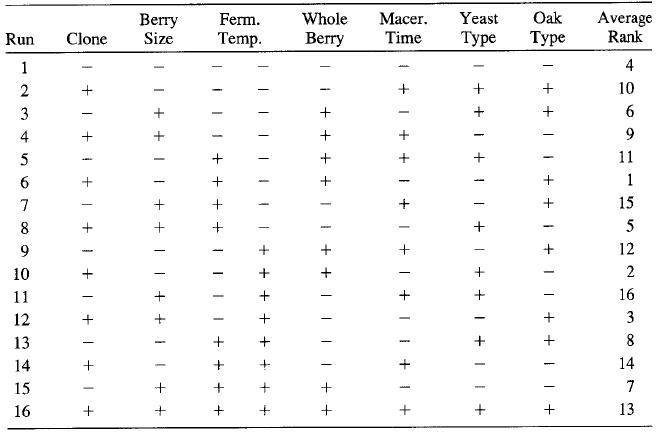
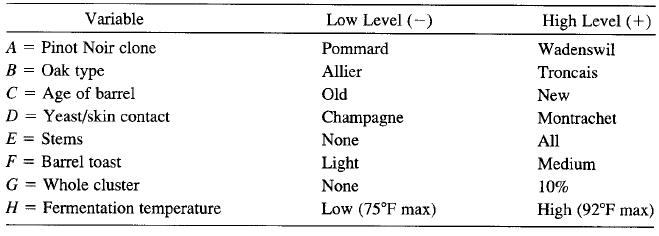
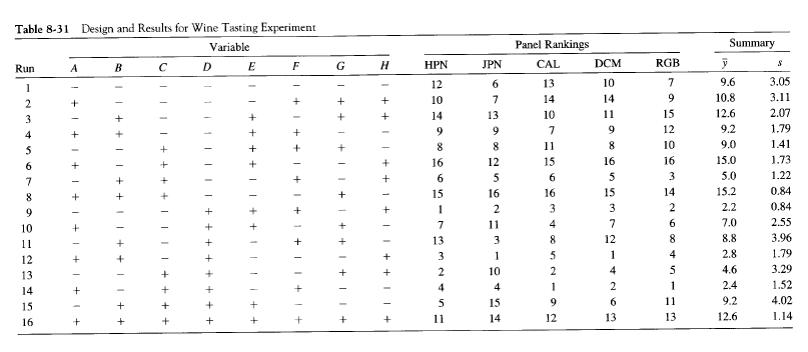
In Problem 8-26, you met Harry and Judy Peterson-Nedry, two friends of the author who have a winery and vineyard in Newberg, Oregon. That problem described the application of two-level fractional factorial designs to their 1985 Pinot Noir product. In 1987, they wanted to conduct another Pinot Noir
Starting with a 16-run 24 design, show how one three-level factor and three two-level factors can be accommodated and still allow the estimation of two-factor interactions.
Starting with a 16-run 24 design, show how two three-level factors can be incorporated in this experiment. How many two-level factors can be included if we want some information on two-factor interactions?
Outline the analysis of variance table for a 2232 factorial design. Discuss how this design may be confounded in blocks.
Construct a 4 x 25 design confounded in two blocks of 16 observations each. Outline the analysis of variance for this design.
Construct a 39-6 design, and verify that it is a resolution III design.
Construct a 35-2 design with I = ABC and I= CDE. Write out the alias structure for this design. What is the resolution of this design?
Verify that the design in Problem 9-14 is a resolution IV design.Problem 9-14Construct a 34-1IV design with I = ABCD. Write out the alias structure for this design.
Construct a 34-1IV design with I = ABCD. Write out the alias structure for this design.
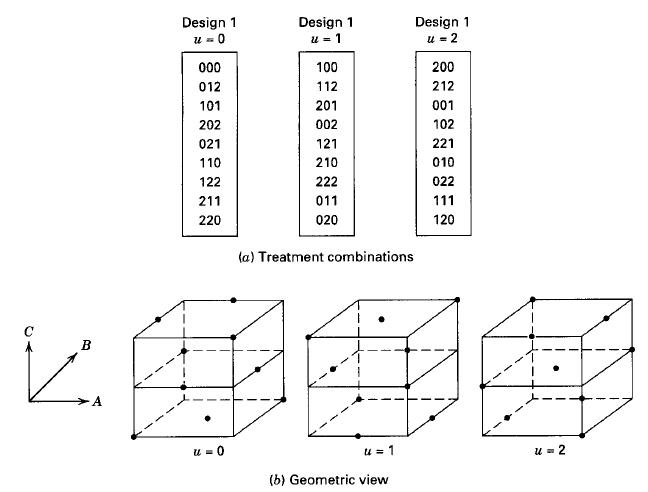
From examining Figure 9-9, what type of design would remain if after completing the first nine runs, one of the three factors could be dropped?Figure 9-9 Design 1 u = 0 Design 1 u = 1 Design 1 u = 2 000 100 200 012 112 212 101 201 001 202 002 102 021 121 221 110 210 010 122 222 022 211 011 111 220
Consider the data from replicate I of Problem 9-3. Suppose that only a one-third fraction of this design with I = ABC is run. Construct the design, determine the alias structure, and analyze the data.Problem 9-3.An experiment was performed to study the effect of three different types of 32-ounce
Consider the data in Problem 9-3. If ABC is confounded in replicate I and ABC2 is confounded in replicate II, perform the analysis of variance.Problem 9-3.An experiment was performed to study the effect of three different types of 32-ounce bottles (A) and three different shelf types (B)—smooth
Outline the analysis of variance table for the 34 design in nine blocks. Is this a practical design?
Consider the data from the first replicate of Problem 9-3. Assuming that all 27 observations could not be run on the same day, set up a design for conducting the experiment over three days with AB2C confounded with blocks. Analyze the data.Problem 9-3.An experiment was performed to study the effect
Confound a 3° design in three blocks using the AB2CD component of the four-factor interaction.
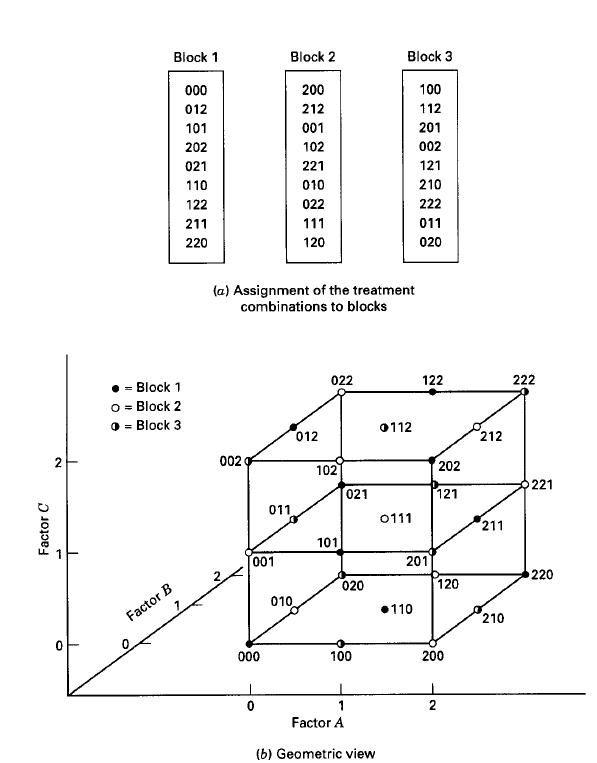
(a) Confound a 33 design in three blocks using the ABC2 component of the three-factor interaction. Compare your results with the design in Figure 9-7.(b) Confound a 33 design in three blocks using the AB2C component of the three-factor interaction. Compare your results with the design in Figure
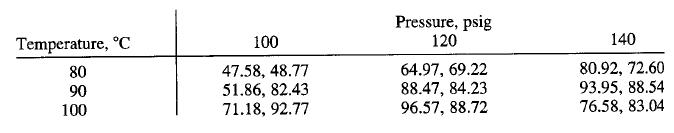
An experiment is run in a chemical process using a 32 factorial design. The design factors are temperature and pressure, and the response variable is yield. The data that result from this experiment are shown below:(a) Analyze the data from this experiment by conducting an analysis of variance.
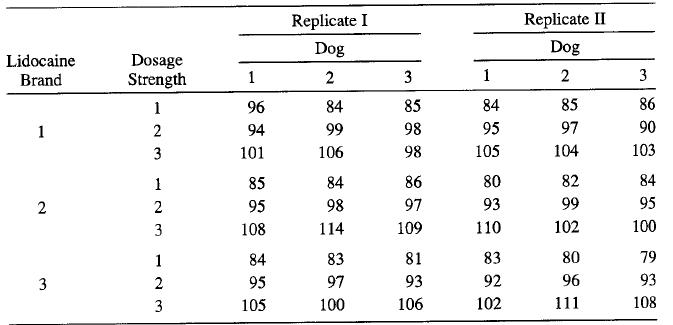
A medical researcher is studying the effect of lidocaine on the enzyme level in the heart muscle of beagle dogs. Three different commercial brands of lidocaine (A), three dosage levels (B), and three dogs (C) are used in the experiment, and two replicates of a 33 factorial design are run. The
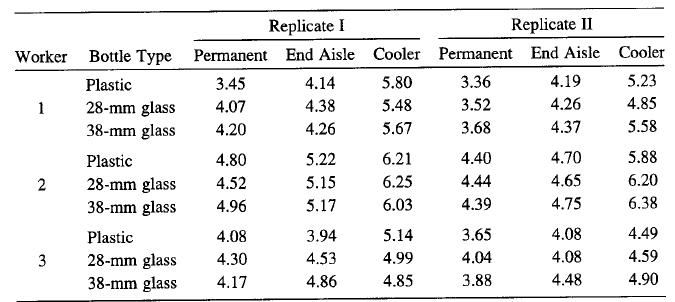
An experiment was performed to study the effect of three different types of 32-ounce bottles (A) and three different shelf types (B)—smooth permanent shelves, end-aisle displays with grilled shelves, and beverage coolers—on the time it takes to stock ten 12-bottle cases on the shelves. Three
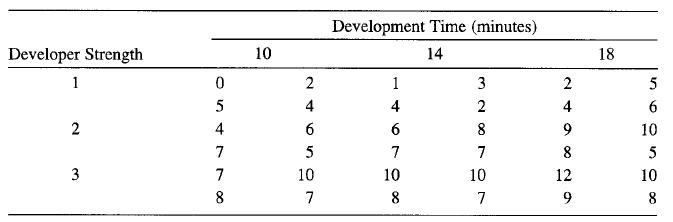
Compute the I and J components of the two-factor interaction in Problem 9-1.Problem 9-1.The effects of developer strength (A) and development time (B) on the density of photographic plate film are being studied. Three strengths and three times are used, and four replicates of a 32 factorial
The effects of developer strength (A) and development time (B) on the density of photographic plate film are being studied. Three strengths and three times are used, and four replicates of a 32 factorial experiment are run. The data from this experiment follow. Analyze the data using the standard
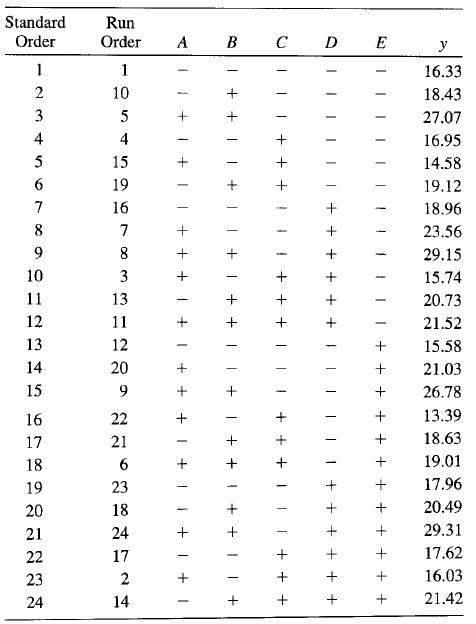
Five factors are studied in the irregular fractional factorial design of resolution V shown below: (a) Analyze the data from this experiment. What factors influence the response y?(b) Analyze the residuals. Comment on model adequacy. Standard Run Order Order А В С D E y 1 1 16.33 10 18.43 3
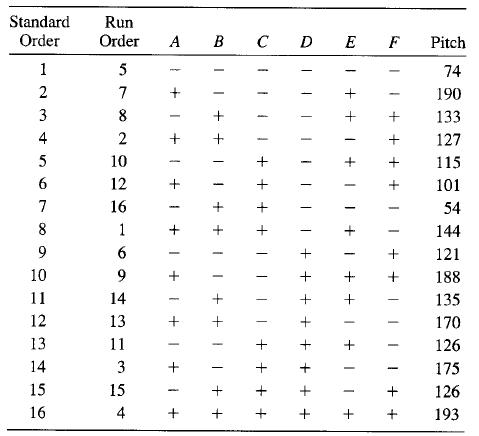
Heat treating is often used to carbonize metal parts, such as gears. The thickness of the carbonized layer is a critical output variable from this process, and it is usually measured by performing a carbon analysis on the gear pitch (the top of the gear tooth). Six factors were studied in a 472
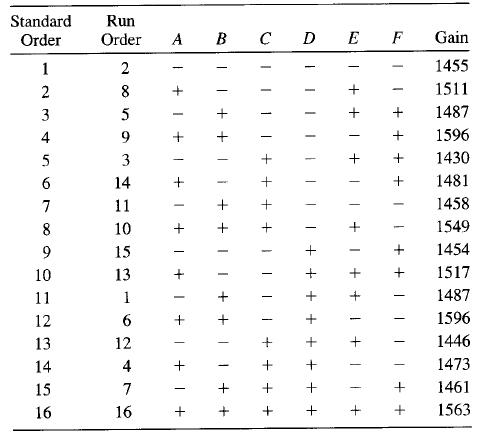
An experiment is run in a semiconductor factory to investigate the effect of six factors on transistor gain. The design selected is the 26-2IV shown below: (a) Use a normal plot of the effects to identify the significant factors.(b) Conduct appropriate statistical tests for the model
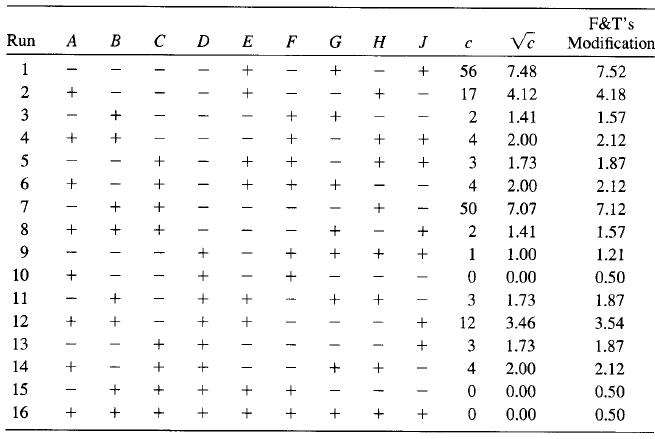
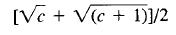
A 16-run fractional factorial experiment in nine factors was conducted by Chrysler Motors Engineering and described in the article "Sheet Molded Compound Process Improvement," by P. I. Hsieh and D. E. Goodwin (Fourth Symposium on Taguchi Methods, American Supplier Institute, Dearborn, MI, 1986, pp.
A 16-run fractional factorial experiment in 10 factors on sand-casting of engine manifolds was conducted by engineers at the Essex Aluminum Plant of the Ford Motor Company and described in the article "Evaporative Cast Process 3.0 Liter Intake Manifold Poor Sandfill Study," by D. Becknell (Fourth
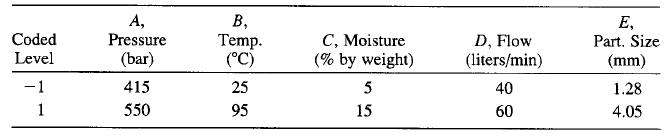
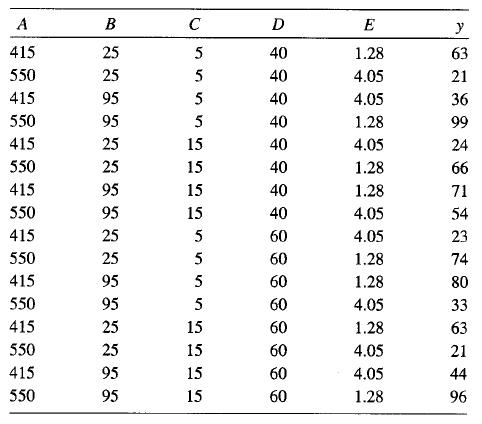
In an article in Quality Engineering ("An Application of Fractional Factorial Experimental Designs," 1988, Vol. 1, pp. 19-23) M. B. Kilgo describes an experiment to determine the effect of CO2 pressure (A), CO2 temperature (B), peanut moisture (C), CO2 flow rate (D), and peanut particle size (E) on
Harry and Judy Peterson-Nedry (two friends of the author) own a vineyard and winery in Newberg, Oregon. They grow several varieties of grapes and manufacture wine. Harry and Judy have used factorial designs for process and product development in the wine-making segment of their business. This
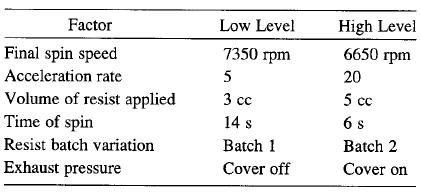
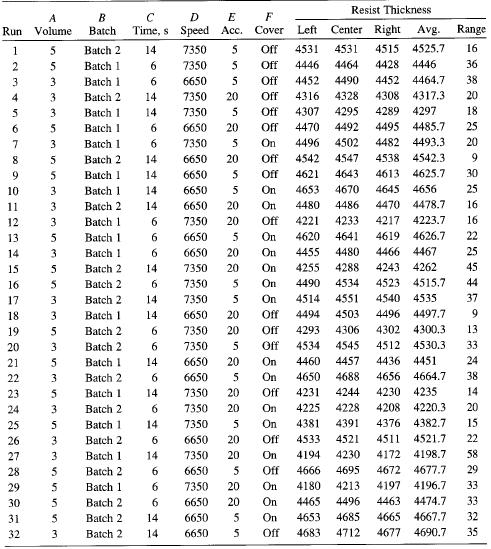
A spin coater is used to apply photoresist to a bare silicon wafer. This operation usually occurs early in the semiconductor manufacturing process, and the average coating thickness and the variability in the coating thickness has an important impact on downstream manufacturing steps. Six variables
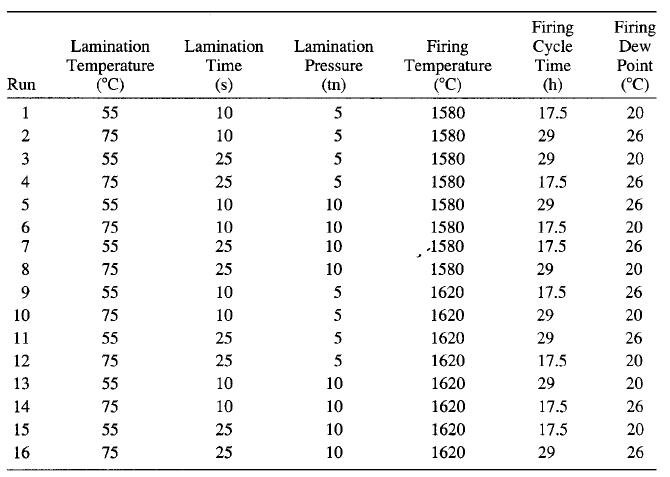
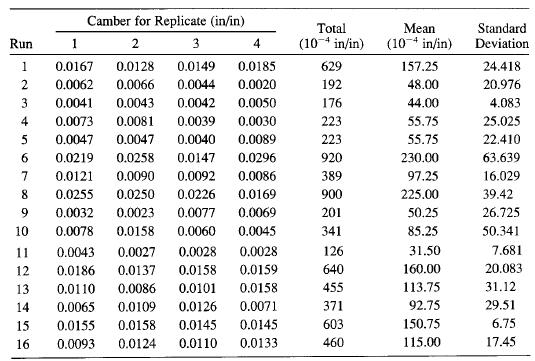
A 16-run experiment was performed in a semiconductor manufacturing plant to study the effects of six factors on the curvature or camber of the substrate devices produced. The six variables and their levels are shown below:Each run was replicated four times, and a camber measurement was taken on the
Carbon anodes used in a smelting process are baked in a ring furnace. An experiment is run in the furnace to determine which factors influence the weight of packing material that is stuck to the anodes after baking. Six variables are of interest, each at two levels: A = pitch/fines ratio (0.45,
Consider a 24 design. We must estimate the four main effects and the six two-factor interactions, but the full 24 factorial cannot be run. The largest possible block size contains 12 runs. These 12 runs can be obtained from the four one-quarter replicates defined by I = ±AB = ±ACD = ±BCD by
Construct a 25-1 design. Show how the design may be run in two blocks of eight observations each. Are any main effects or two-factor interactions confounded with blocks?
An industrial engineer is conducting an experiment using a Monte Carlo simulation model of an inventory system. The independent variables in her model are the order quantity (A), the reorder point (B), the setup cost (C), the backorder cost (D), and the carrying cost rate (E). The response variable
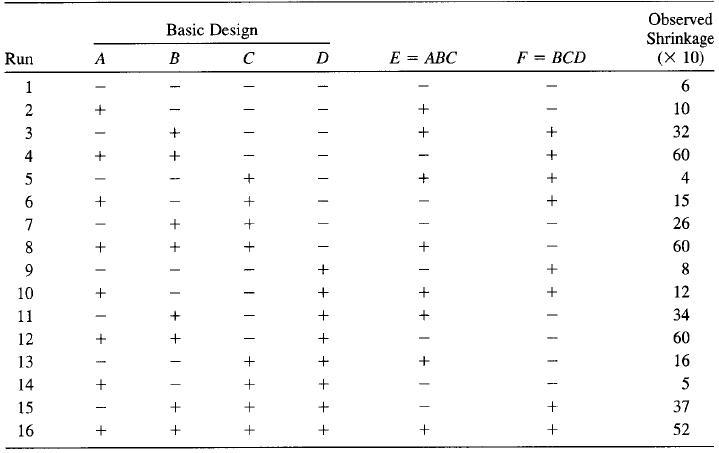
Fold over a 25-2IV design to produce a six-factor design. Verify that the resulting design is a 26-2IV design. Compare this design to the 26-2IV design in Table 8-10.Table 8-10. Observed Shrinkage (X 10) Basic Design Run E = ABC F = BCD 6 9 60 16 14 15 16 II + + + + || + + IIII+ + I + +I + II +I+
Construct a 26-3III design. Determine the effects that may be estimated if a second fraction of this design is run with all signs reversed.
Analyze the data in Problem 6-23 as if it came from a 24-1IV design with 1 = ABCD. Project the design into a full factorial in the subset of the original four factors that appear to be significant.Problem 6-23In a process development study on yield, four factors were studied, each at two levels:
Repeat Problem 8-12 using 1 = -ABCD. Does use of the alternate fraction change your interpretation of the data?Problem 8-12Analyze the data in Problem 6-23 as if it came from a 24-1IV design with 1 = ABCD. Project the design into a full factorial in the subset of the original four factors that
Analyze the data in Problem 6-23 as if it came from a 24-1IV design with 1 = ABCD. Project the design into a full factorial in the subset of the original four factors that appear to be significant.Problem 6-23In a process development study on yield, four factors were studied, each at two levels:
Construct a 27-2 design by choosing two four-factor interactions as the independent gen-erators. Write down the complete alias structure for this design. Outline the analysis of variance table. What is the resolution of this design?
Suppose you have made the eight runs in the 25-2 design in Problem 8-4. What additional runs would be required to identify the factor effects that are of interest? What are the alias relationships in the combined design?Problem 8-4.Problem 6-21 describes a process improvement study in the
Problem 6-21 describes a process improvement study in the manufacturing process of an integrated circuit. Suppose that only eight runs could be made in this process. Set up an appropriate 25-2 design and find the alias structure. Use the appropriate observations from Problem 6-21 as the
Consider the plasma etch experiment described in Problem 6-18. Suppose that only a one-half fraction of the design could be run. Set up the design and analyze the data.Problem 6-18. An article in Solid State Technology ("Orthogonal Design for Process Optimization and Its Application in Plasma
Suppose that in Problem 6-15, only a one-half fraction of the 24 design could be run. Construct the design and perform the analysis, using the data from replicate I.Problem 6-15. A nickel-titanium alloy is used to make components for jet turbine aircraft engines. Cracking is a potentially
Suppose that in the chemical process development experiment described in Problem 6-7, it was only possible to run a one-half fraction of the 24 design. Construct the design and perform the statistical analysis, using the data from replicate I.
Construct a 23 design with ABC confounded in the first two replicates and BC confounded in the third. Outline the analysis of variance and comment on the information obtained.
Suppose that in Problem 6-7 ABCD was confounded in replicate I and ABC was con-founded in replicate II. Perform the statistical analysis of this design.Problem 6-7An experiment was performed to improve the yield of a chemical process. Four factors were selected, and two replicates of a completely
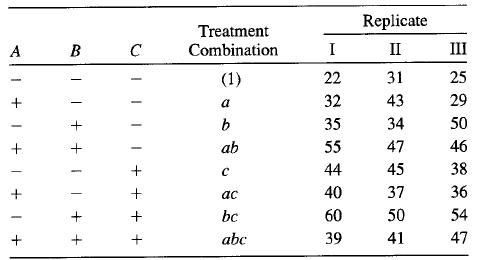
Repeat Problem 6-1 assuming that ABC was confounded with blocks in each replicate.Problem 6-1.An engineer is interested in the effects of cutting speed (A), tool geometry (B), and cutting angle (C) on the life (in hours) of a machine tool. Two levels of each factor are chosen, and three replicates
Suppose that in Problem 6-1 we had confounded ABC in replicate I, AB in replicate II, and BC in replicate III. Calculate the factor effect estimates. Construct the analysis of variance table. Problem 6-1.An engineer is interested in the effects of cutting speed (A), tool geometry (B), and
Consider the data in Example 7-2. Suppose that all the observations in block 2 are in-creased by 20. Analyze the data that would result. Estimate the block effect. Can you explain its magnitude? Do blocks now appear to be an important factor? Are any other effect estimates impacted by the change
Consider the 26 design in eight blocks of eight runs each with ABCD, ACE, and ABEF as the independent effects chosen to be confounded with blocks. Generate the design. Find the other effects confounded with blocks.
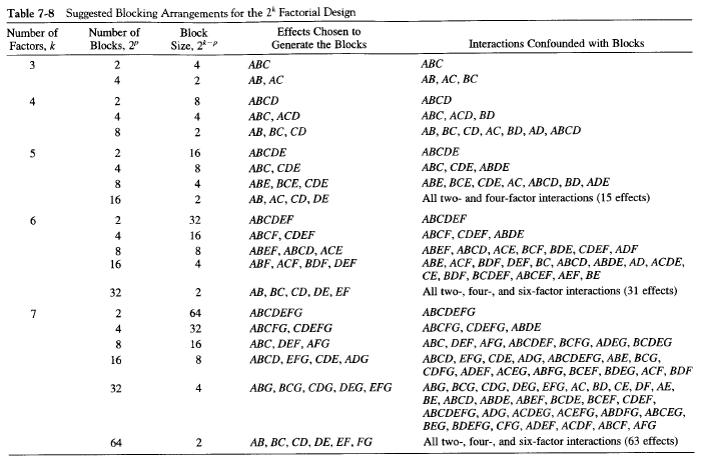
Design an experiment for confounding a 26 factorial in four blocks. Suggest an appropriate confounding scheme, different from the one shown in Table 7-8.Table 7-8.
Consider the data from the 25 design in Problem 6-21. Suppose that it was necessary to run this design in four blocks with ACDE and BCD (and consequently ABE) confounded. Analyze the data from this design.Problem 6-21An experiment was run in a semiconductor fabrication plant in an effort to
Repeat Problem 7-7 assuming that four blocks are necessary. Suggest a reasonable con-founding scheme.Problem 7-7An experiment was run in a semiconductor fabrication plant in an effort to increase yield. Five factors, each at two levels, were studied. The factors (and levels) were A = aperture
Repeat Problem 7-5 assuming that four blocks are required. Confound ABD and ABC (and consequently CD) with blocks.Problem 7-5 Consider the data from the first replicate of Problem 6-7. Construct a design with two blocks of eight observations each with ABCD confounded. Analyze the data.Problem
Consider the data from the first replicate of Problem 6-7. Construct a design with two blocks of eight observations each with ABCD confounded. Analyze the data.Problem 6-7.An experiment was performed to improve the yield of a chemical process. Four factors were selected, and two replicates of a
Consider the data from the first replicate of Problem 6-1. Suppose that these observations could not all be run using the same bar stock. Set up a design to run these observations in two blocks of four observations each with ABC confounded. Analyze the data.Problem 6-1.An engineer is interested in
Consider the alloy cracking experiment described in Problem 6-15. Suppose that only 16 runs could be made on a single day, so each replicate was treated as a block. Analyze the experiment and draw conclusions.Problem 6-15. A nickel-titanium alloy is used to make components for jet turbine
Consider the experiment described in Problem 6-5. Analyze this experiment assuming that each one of the four replicates represents a block.Problem 6-5.A router is used to cut locating notches on a printed circuit board. The vibration level at the surface of the board as it is cut is considered to
Consider the experiment described in Problem 6-1. Analyze this experiment assuming that each replicate represents a block of a single production shift.Problem 6-1.An engineer is interested in the effects of cutting speed (A), tool geometry (B), and cutting angle (C) on the life (in hours) of a
Often the fitted regression model from a 2k factorial design is used to make predictions at points of interest in the design space.(a) Find the variance of the predicted response ŷ at a point x1, x2, . xk in the design space. Remember that the x's are coded variables, and assume a 2k design
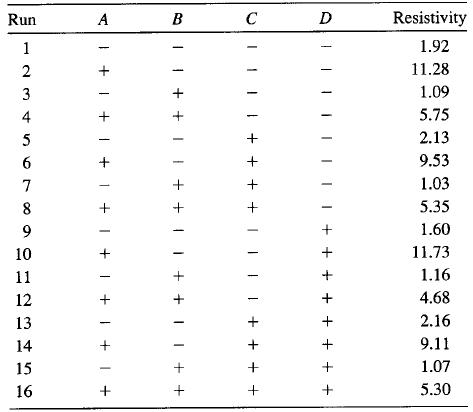
Continuation of Problem 6-31. Suppose that the experimenter had also run four center points along with the 16 runs in Problem 6-31. The resistivity measurements at the center points are 8.15, 7.63, 8.95, and 6.48. Analyze the experiment again incorporating the center points. What conclusions can
Resistivity on a silicon wafer is influenced by several factors. The results of a 24 factorial experiment performed during a critical processing step is shown in the following table: (a) Estimate the factor effects. Plot the effect estimates on a normal probability plot and select a tentative
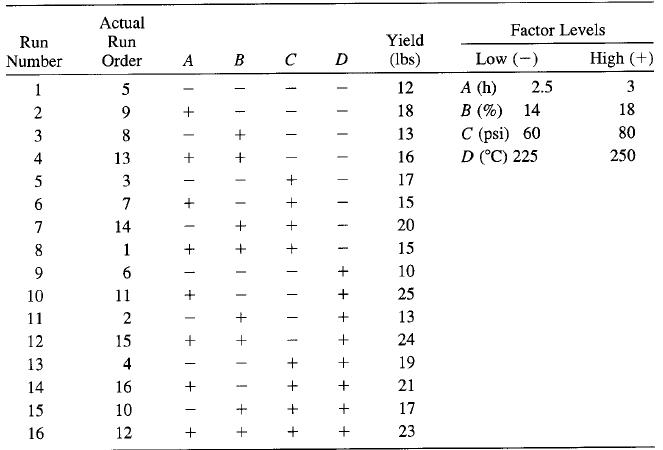
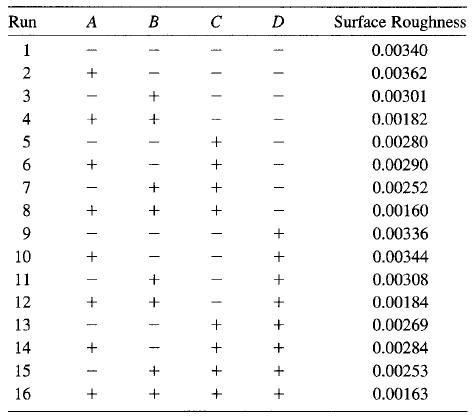
An engineer has performed an experiment to study the effect of four factors on the surface roughness of a machined part. The factors (and their levels) are A = tool angle (12, 15°). B = cutting fluid viscosity (300, 400), C = feed rate (10, 15 in/min), and D = cutting fluid cooler used (no, yes).
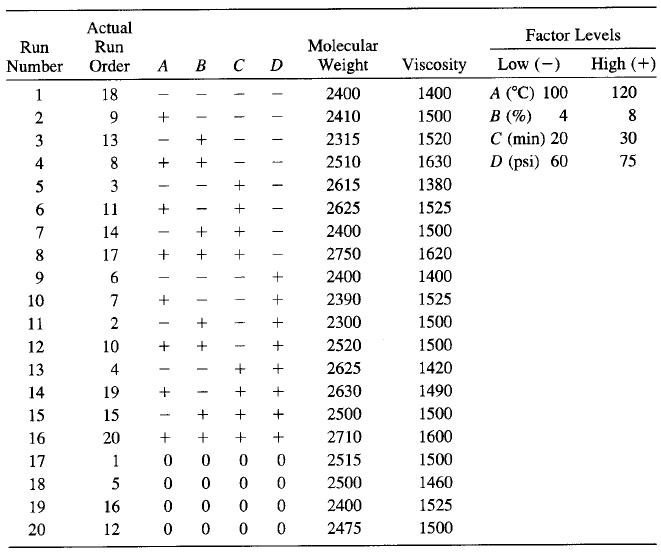
Use the regression models for molecular weight and viscosity to answer the following questions.(a) Construct a response surface contour plot for molecular weight. In what direction would you adjust the process variables to increase molecular weight?(b) Construct a response surface contour plot for
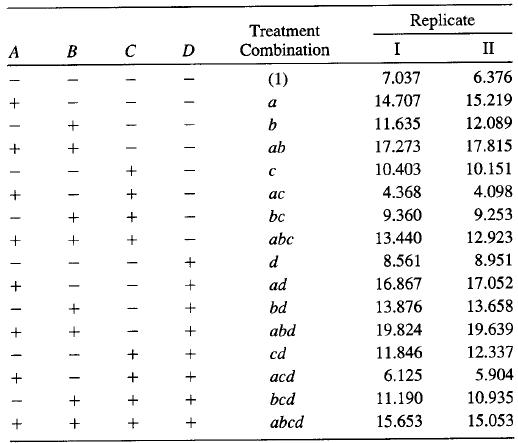
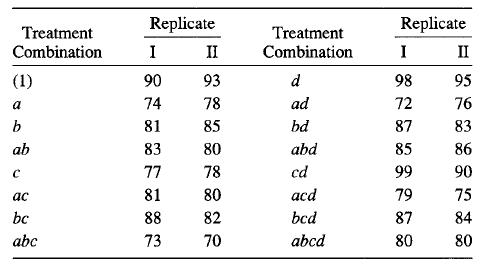
An experiment was conducted on a chemical process that produces a polymer. The four factors studied were temperature (A), catalyst concentration (B), time (C), and pressure (D). Two responses, molecular weight and viscosity, were observed. The design matrix and response data are shown below:(a)
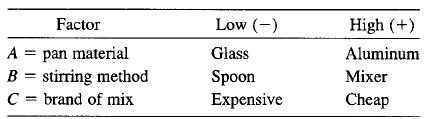
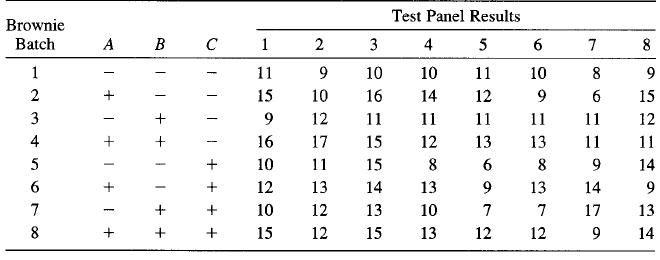
The scrumptious brownie experiment. The author is an engineer by training and a firm believer in learning by doing. I have taught experimental design for many years to a wide variety of audiences and have always assigned the planning, conduct, and analysis of an actual experiment to the class
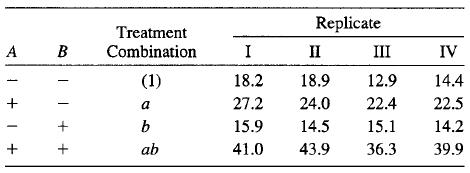
In a process development study on yield, four factors were studied, each at two levels: time (A), concentration (B), pressure (C), and temperature (D). A single replicate of a 24 design was run, and the resulting data are shown in the following table:(a) Construct a normal probability plot of the
Suppose that the experimenter had run four center points in addition to the 32 trials in the original experiment. The yields obtained at the center point runs were 68, 74, 76, and 70.(a) Reanalyze the experiment, including a test for pure quadratic curvature.(b) Discuss what your next step would be.
An experiment was run in a semiconductor fabrication plant in an effort to increase yield. Five factors, each at two levels, were studied. The factors (and levels) were A = aperture setting (small, large), B = exposure time (20% below nominal, 20% above nominal), C = development time (30 s, 45 s),
Consider the single replicate of the 24 design in Example 6-2. Suppose we had arbitrarily decided to analyze the data assuming that all three- and four-factor interactions were negligible. Conduct this analysis and compare your results with those obtained in the example. Do you think that it is a
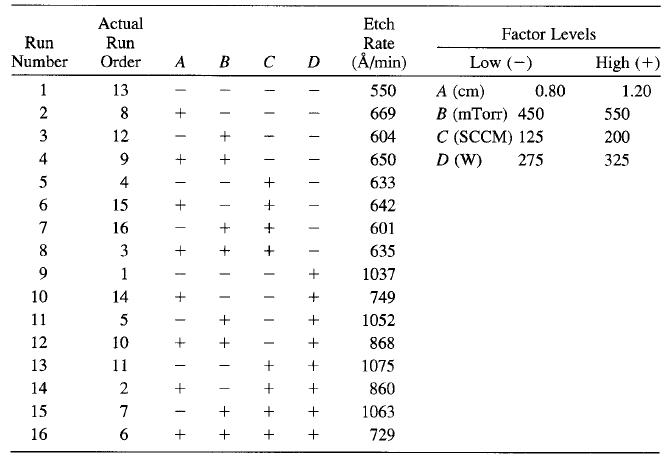
Consider the regression model obtained in part (c) of Problem 6-18.(a) Construct contour plots of the etch rate using this model.(b) Suppose that it was necessary to operate this process at an etch rate of 800 A°/min. What settings of the process variables would you recommend?Problem 6-18.An
An article in Solid State Technology ("Orthogonal Design for Process Optimization and Its Application in Plasma Etching," May 1987, pp. 127-132) describes the application of factorial designs in developing a nitride etch process on a single-wafer plasma etcher. The process uses C2F6 as the reactant
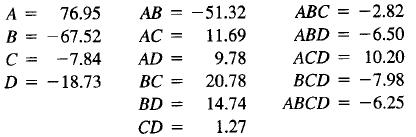
An experimenter has run a single replicate of a 24 design. The following effect estim have been calculated: (a) Construct a normal probability plot of these effects.(b) Identify a tentative model, based on the plot of the effects in part (a). A = 76.95 AB = -51.32 АВС = -2.82 B =
Showing 100 - 200
of 340
1
2
3
4
Step by Step Answers