

Draw a graph with growth per year on the vertical axis and time on the horizontal axis
Question:
Draw a graph with growth per year on the vertical axis and time on the horizontal axis that corresponds with the total growth function in Figure 13.7. Explain why the optimal harvest is unlikely to occur at the highest point of either of these graphs.
Figure 13.7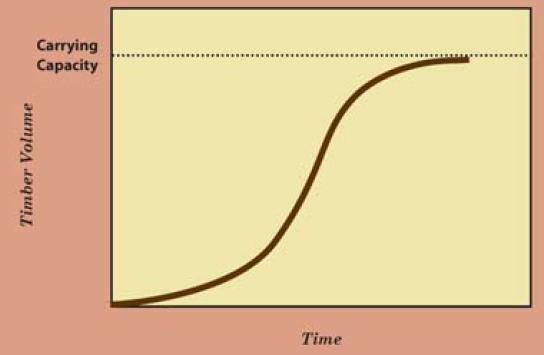
Step by Step Answer:

This question has not been answered yet.
You can Ask your question!
Related Book For 
Environmental Economics And Natural Resource Management
ISBN: 9780415640954
4th Edition
Authors: David A. Anderson
Question Posted:
