

Question: The figure shows a scatterplot of the heights and weights of some women taking statistics. Describe what you see. Is the trend positive, negative, or
The figure shows a scatterplot of the heights and weights of some women taking statistics. Describe what you see. Is the trend positive, negative, or near zero? Explain
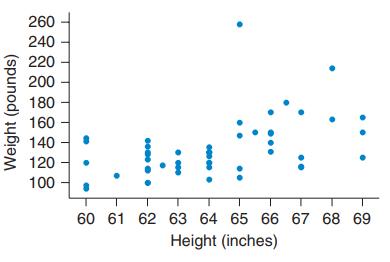
260 240 220 200 180 160 140 120 100 60 61 62 63 64 65 66 67 68 69 Height (inches) Weight (pounds) ..
Step by Step Solution
★★★★★
3.41 Rating (151 Votes )
There are 3 Steps involved in it
1 Expert Approved Answer
Step: 1 Unlock

There is a ... View full answer
Question Has Been Solved by an Expert!
Get step-by-step solutions from verified subject matter experts
Step: 2 Unlock
Step: 3 Unlock