

The figure shows a scatterplot of shoe size and GPA for some college students. Does it show
Question:
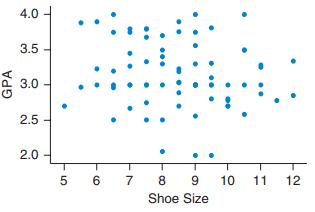
The figure shows a scatterplot of shoe size and GPA for some college students. Does it show an increasing trend, a decreasing trend, or no trend? Is there a strong relationship?
Fantastic news! We've Found the answer you've been seeking!
Step by Step Answer:
The points appear to ...View the full answer

Answered By
Charles mwangi
I am a postgraduate in chemistry (Industrial chemistry with management),with writing experience for more than 3 years.I have specialized in content development,questions,term papers and assignments.Majoring in chemistry,information science,management,human resource management,accounting,business law,marketing,psychology,excl expert ,education and engineering.I have tutored in other different platforms where my DNA includes three key aspects i.e,quality papers,timely and free from any academic malpractices.I frequently engage clients in each and every step to ensure quality service delivery.This is to ensure sustainability of the tutoring aspects as well as the credibility of the platform.
2+ Reviews
10+ Question Solved
Related Book For 

Essential Statistics
ISBN: 9780134134406
2nd Edition
Authors: Robert Gould, Colleen N. Ryan, Rebecca Wong
Question Posted:
