

The histograms show the distribution of the estimated numbers of dollars per month spent on clothes for
Question:
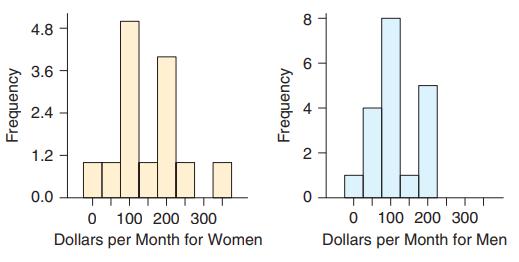
The histograms show the distribution of the estimated numbers of dollars per month spent on clothes for college women (left) and college men (right).
a. Compare and describe the shape of the distributions.
b. Which group tends to spend more?
c. Which group has more variation in its expenditures?
Fantastic news! We've Found the answer you've been seeking!
Step by Step Answer:
a Both graphs are bimodal with ...View the full answer

Answered By
ANDREW KIPRUTO
Academic Writing Expert
I have over 7 years of research and application experience. I am trained and licensed to provide expertise in IT information, computer sciences related topics and other units like chemistry, Business, law, biology, biochemistry, and genetics. I'm a network and IT admin with +8 years of experience in all kind of environments.
I can help you in the following areas:
Networking
- Ethernet, Wireless Airmax and 802.11, fiber networks on GPON/GEPON and WDM
- Protocols and IP Services: VLANs, LACP, ACLs, VPNs, OSPF, BGP, RADIUS, PPPoE, DNS, Proxies, SNMP
- Vendors: MikroTik, Ubiquiti, Cisco, Juniper, HP, Dell, DrayTek, SMC, Zyxel, Furukawa Electric, and many more
- Monitoring Systems: PRTG, Zabbix, Whatsup Gold, TheDude, RRDtoo
Always available for new projects! Contact me for any inquiries
1+ Reviews
10+ Question Solved
Related Book For 

Essential Statistics
ISBN: 9780134134406
2nd Edition
Authors: Robert Gould, Colleen N. Ryan, Rebecca Wong
Question Posted:
