

Question: The scatterplot shows the actual weight and desired weight change of some students. Thus, if a student weighed 220 and wanted to weigh 190, the
The scatterplot shows the actual weight and desired weight change of some students. Thus, if a student weighed 220 and wanted to weigh 190, the desired weight change would be negative 30.
Explain what you see. In particular, what does it mean that the trend is negative?
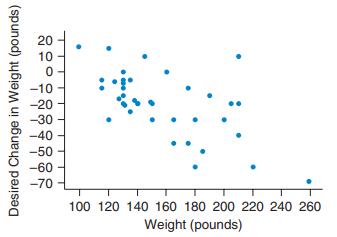
20 10 -10 -20 -30 -40 -50 -60 -70 100 120 140 160 180 200 220 240 260 Weight (pounds) Desired Change in Weight (pounds)
Step by Step Solution
★★★★★
3.44 Rating (163 Votes )
There are 3 Steps involved in it
1 Expert Approved Answer
Step: 1 Unlock

The more peo... View full answer
Question Has Been Solved by an Expert!
Get step-by-step solutions from verified subject matter experts
Step: 2 Unlock
Step: 3 Unlock