

Question: 7. (LO 7.8) A well-designed data visualization can be very helpful in understanding a companys past performance so that managers can adjust current/future activities. The
7. (LO 7.8) A well-designed data visualization can be very helpful in understanding a company’s past performance so that managers can adjust current/future activities. The following data visualization was created to answer the following questions:29
• How does the production budget required to make the film compare to worldwide grosses (revenues) for the film?
• How do different blockbusters from 1996 to 2009 compare based on production budget and worldwide gross?
How well does the data visualization answer these questions?
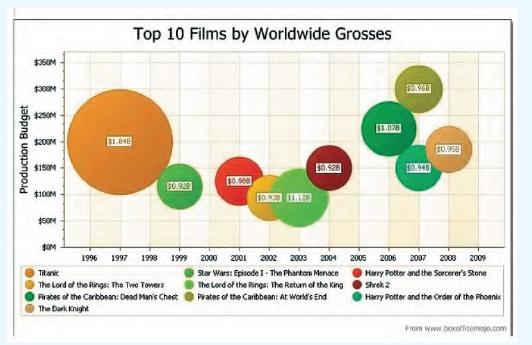
Production Budget $350M $300M $250M $200M $1.848 $150M $100M Top 10 Films by Worldwide Grosses $0.928 10.980 $0.928 $1.078 50.940 $0.958 $50M $OM Titanic 1996 1997 1998 1999 2000 2001 2002 2003 2004 Star Wars: Episode 1- The Phantom Menace The Lord of the Rings: The Return of the King Pirates of the Caribbean: At World's End The Lord of the Rings: The Two Towers Pirates of the Caribbean: Dead Man's Chest The Dark Knight 2005 2006 2007 2006 2009 Harry Potter and the Sorcerer's Stone Shrek 2 Harry Potter and the Order of the Phoenix From wwww.boxofficemojo.com
Step by Step Solution
There are 3 Steps involved in it

Get step-by-step solutions from verified subject matter experts