

Predicting Boston Housing Prices. The file BostonHousing.csv contains information collected by the US Bureau of the Census
Question:
Predicting Boston Housing Prices. The file BostonHousing.csv contains information collected by the US Bureau of the Census concerning housing in the area of Boston, Massachusetts. The dataset includes information on 506 census housing tracts in the Boston area. The goal is to predict the median house price in new tracts based on information such as crime rate, pollution, and number of rooms. The dataset contains 13 predictors, and the target attribute is the median house price (MEDV). Table 6. 3 describes each of the predictors and the target attribute.
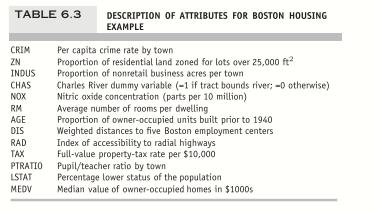
a. Why should the data be partitioned into training, validation, and holdout sets? What will the training set be used for? What will the validation and holdout sets be used for?
b. Partition the data into training/validation/holdout with proportions 60 : 25 : 15. Fit a multiple linear regression model to the median house price (MEDV) as a function of CRIM, CHAS, and RM. Write the equation for predicting the median house price from the predictors in the model.
c. Using the estimated regression model, what median house price is predicted for atract in the Boston area that does not bound the Charles River, has a crime rate of 0.1, and where the average number of rooms per house is 6?
d. Reduce the number of predictors:
i. Which predictors are likely to be measuring the same thing among the 13 predictors? Discuss the relationships among INDUS, NOX, and TAX.
ii. Compute the correlation table for the 12 numerical predictors using the Correlation Matrix operator in RapidMiner, and search for highly correlated pairs. These have potential redundancy and can cause multicollinearity. Choose which ones to remove based on this table.
iii. Use three subset selection algorithms: backward, forward, and stepwise to reduce the remaining predictors. Compute the validation performance for each of the three selected models. Compare RMSE, MAPE, and mean error, as well as histograms of the errors. Finally, describe the best model.
iv. Evaluate the performance of the best model on the holdout data. Report its holdout RMSE, MAPE, and mean error.
Step by Step Answer:


Machine Learning For Business Analytics
ISBN: 9781119828792
1st Edition
Authors: Galit Shmueli, Peter C. Bruce, Amit V. Deokar, Nitin R. Patel
