

Figure 8.15 shows a graph of state senatorial elections in Philadelphia from 1982 through 1993. Table 8.14
Question:
Figure 8.15 shows a graph of state senatorial elections in Philadelphia from 1982 through 1993. Table 8.14 shows the data (Democrat minus Republican) for the 21 elections preceding the disputed 1993 election. Estimate the regression model Y = α + βX + ε, where the dependent variable is the absentee ballots and the explanatory variable is the Election Day ballots. In the disputed 1993 election, the difference in the Election Day ballots was −564. Find a 95 percent prediction interval for the absentee ballots in 1993.
Is 1,025, the actual value for the absentee ballots, inside this prediction interval?
Table 8.14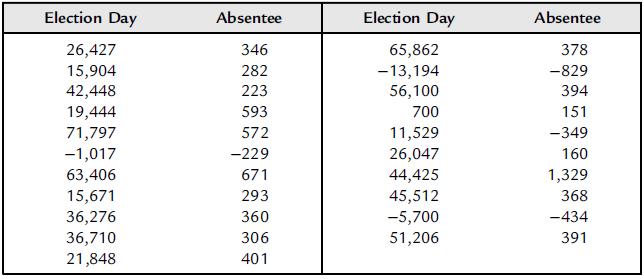
Figure 8.15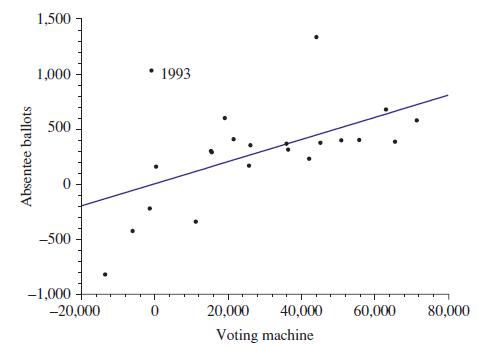
Step by Step Answer:

This question has not been answered yet.
You can Ask your question!
Related Book For 

Essential Statistics Regression And Econometrics
ISBN: 9780123822215
1st Edition
Authors: Gary Smith
Question Posted:
