

Using data for 1901 through 1999, annual batting averages (BAs) were tabulated for all Major League Baseball
Question:
Using data for 1901 through 1999, annual batting averages (BAs) were tabulated for all Major League Baseball (MLB) players for each season in which the player had at least 50 times at bat. For each season, each player’s BA was converted to a standardized Z value by subtracting the average BA for all players that year and dividing by the standard deviation of BAs that year [1]. The annual Z values were grouped according to whether it was the player’s first year in the major leagues, second year, and so on. The average Z value was then calculated for each career year. For example, looking at each player’s first year in the major leagues, the average Z value is −0.337.
a. Use the data in Table 11.2 to estimate the multiple regression equation Z = α + β1t +
β2t2.
b. Are the coefficients of t and t2 statistically significant at the 5 percent level?
c. What do the signs of t and t2 tell you about the shape of the fitted line?
d. Explain why a comparison of the predicted Z value for t = 1 and t = 2 does not tell us the predicted change in the Z value if all first-year players were to play a second year in the majors.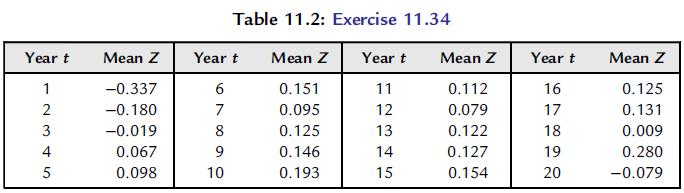
Step by Step Answer:


Essential Statistics Regression And Econometrics
ISBN: 9780123822215
1st Edition
Authors: Gary Smith
