

The accompanying diagram shows the inflation rate in the United Kingdom from 1980 to 2016. a. Between
Question:
The accompanying diagram shows the inflation rate in the United Kingdom from 1980 to 2016.
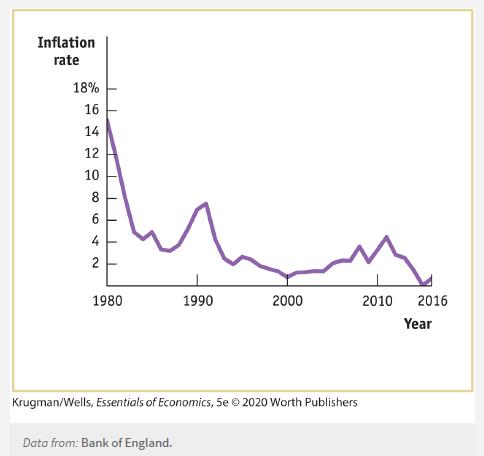
a. Between 1980 and 1985, policy makers in the United Kingdom worked to lower the inflation rate. What would you predict happened to unemployment between 1980 and 1985?
b. Policy makers in the United Kingdom react forcefully when the inflation rate rises above a target rate of 2%. Why would it be harmful if inflation rose from 0.7% (the level in 2016) to, say, a level of 5%?
Fantastic news! We've Found the answer you've been seeking!
Step by Step Answer:

Answered By
AJIN KURIAKOSE
I HAVE ELECTRONICS ENGINEERING DEGREE..AND MY AREA OF INTEREST IS MATHEMATICS,CONTROL SYSTEM,NETWORK,DIGITAL
21+ Reviews
32+ Question Solved
Related Book For 
Question Posted:
