The accompanying table shows data on nominal GDP (in billions of dollars), real GDP (in billions of
Question:
The accompanying table shows data on nominal GDP (in billions of dollars), real GDP (in billions of 2009 dollars), and population (in thousands) of the United States in 1965, 1975, 1985, 1995, 2005, and 2015. The U.S. price level rose consistently over the period 1965–2015.
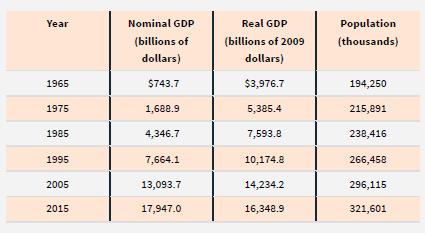
a. Why is real GDP greater than nominal GDP for all years until 2005 and lower for 2015?
b. Calculate the percent change in real GDP from 1965 to 1975, 1975 to 1985, 1985 to 1995, 1995 to 2005, and 2005 to 2015. Which period had the highest growth rate?
c. Calculate real GDP per capita for each of the years in the table.
d. Calculate the percent change in real GDP per capita from 1965 to 1975, 1975 to 1985, 1985 to 1995, 1995 to 2005, and 2005 to 2015. Which period had the highest growth rate?
e. How do the percent change in real GDP and the percent change in real GDP per capita compare? Which is larger? Do we expect them to have this relationship?
Step by Step Answer: