

The accompanying diagram shows the demand and supply curves for taxi rides in New York City. a.
Question:
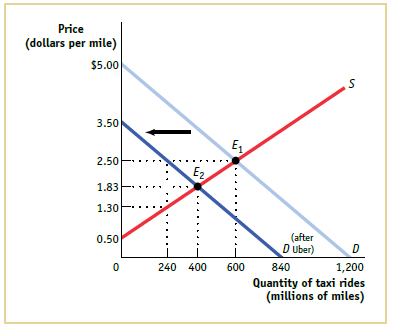
a. At E1 the market is at equilibrium with 600 million miles of rides transacted at an equilibrium price of $2.50. Calculate consumer surplus, producer surplus, and total surplus at E1.
b. Uber€™s entry into the market reduces the quantity of rides demanded from taxis by 30% at every price, shifting the demand curve leftward. Assume that New York City politicians respond by imposing a regulated price of $2.50 per mile. Calculate consumer surplus, producer surplus, and total surplus for the taxi market after Uber has entered the market.
c. After complaints from riders, New York removes the regulated price of $2.50 per mile. What happens to the equilibrium price and quantity? How will taxi drivers and riders be affected?
Fantastic news! We've Found the answer you've been seeking!
Step by Step Answer:
a At a price of 250 per mile and a quantity of 600 million rides consumer surplus is 500 250 600 m...View the full answer

Answered By
Muhammad Umair
I have done job as Embedded System Engineer for just four months but after it i have decided to open my own lab and to work on projects that i can launch my own product in market. I work on different softwares like Proteus, Mikroc to program Embedded Systems. My basic work is on Embedded Systems. I have skills in Autocad, Proteus, C++, C programming and i love to share these skills to other to enhance my knowledge too.
1+ Reviews
10+ Question Solved
Related Book For 

Question Posted:
