

Using the information in Figure 1A.2, calculate the percentage change in Fords auto sales from one year
Question:
Using the information in Figure 1A.2, calculate the percentage change in Ford’s auto sales from one year to the next. During which year did sales fall at the highest rate?
Figure 1A.2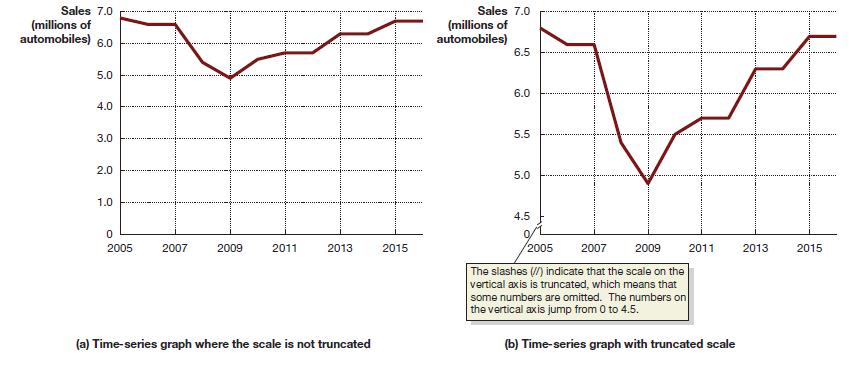
Fantastic news! We've Found the answer you've been seeking!
Step by Step Answer:

Answered By
S Mwaura
A quality-driven writer with special technical skills and vast experience in various disciplines. A plagiarism-free paper and impeccable quality content are what I deliver. Timely delivery and originality are guaranteed. Kindly allow me to do any work for you and I guarantee you an A-worthy paper.
27+ Reviews
73+ Question Solved
Related Book For 

Essentials Of Economics
ISBN: 9780134797731
6th Edition
Authors: R. Glenn Hubbard, Anthony Patrick O brien
Question Posted:
