

Pelican Stores, a division of National Clothing, is a chain of womens apparel stores operating throughout the
Question:
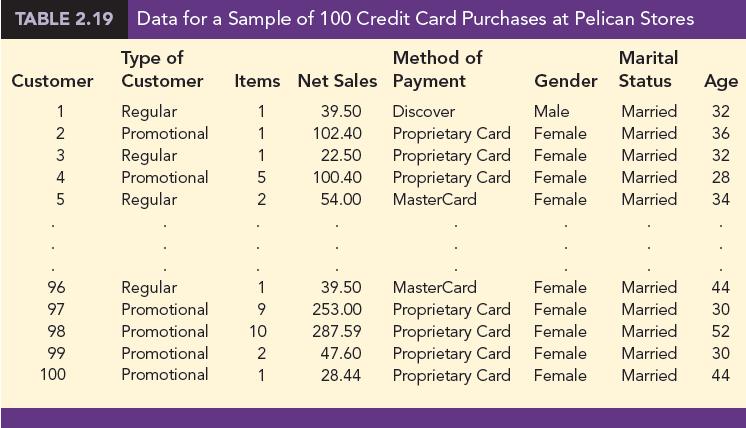
Pelican Stores, a division of National Clothing, is a chain of women’s apparel stores operating throughout the country. The chain recently ran a promotion in which discount coupons were sent to customers of other National Clothing stores. Data collected for a sample of 100 in-store credit card transactions at Pelican Stores during one day while the promotion was running are contained in the file Pelican Stores. Table 2.19 shows a portion of the data set. The Proprietary Card method of payment refers to charges made using a National Clothing charge card. Customers who made a purchase using a discount coupon are referred to as promotional customers, and customers who made a purchase but did not use a discount coupon are referred to as regular customers. Because the promotional coupons were not sent to regular Pelican Stores customers, management considers the sales made to people presenting the promotional coupons as sales it would not otherwise make. Of course, Pelican also hopes that the promotional customers will continue to shop at its stores. Most of the variables shown in Table 2.19 are self-explanatory, but two of the variables require some clarification.
Items The total number of items purchased
Net Sales The total amount ($) charged to the credit card
Pelican’s management would like to use this sample data to learn about its customer base and to evaluate the promotion involving discount coupons. Use the tabular and graphical methods of descriptive statistics to help management develop a customer profile and to evaluate the promotional campaign. At a minimum, your report should include the following:
1. Percent frequency distribution for key variables.
2. A bar chart or pie chart showing the number of customer purchases attributable to the method of payment.
3. A crosstabulation of type of customer (regular or promotional) versus net sales. Comment on any similarities or differences present.
4. A scatter diagram to explore the relationship between net sales and customer age.
Step by Step Answer:
1 There were 70 promotional customers and 30 regular customers Because there are 100 observations in ...View the full answer


Essentials Of Modern Business Statistics With Microsoft Excel
ISBN: 9780357131626
8th Edition
Authors: David R. Anderson, Dennis J. Sweeney, Thomas A. Williams, Jeffrey D. Camm, James J. Cochran
