

Cost-to-charge ratios (see Example 4.9 for a definition of this ratio) were reported for the 10 hospitals
Question:
Cost-to-charge ratios (see Example 4.9 for a definition of this ratio) were reported for the 10 hospitals in California with the lowest ratios (San Luis Obispo Tribune, December 15, 2002). These ratios represent the 10 hospitals with the highest markup, because for these hospitals, the actual cost was only a small percentage of the amount billed. The 10 cost-to-charge values (percentages) were
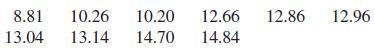
a. Compute the variance and standard deviation for this data set.
b. If cost-to-charge data were available for all hospitals in California, would the standard deviation of this data set be larger or smaller than the standard deviation computed in Part (a) for the 10 hospitals with the lowest cost-to-charge values? Explain.
c. Explain why it would not be reasonable to use the data from the sample of 10 hospitals in Part (a) to draw conclusions about the population of all hospitals in California.
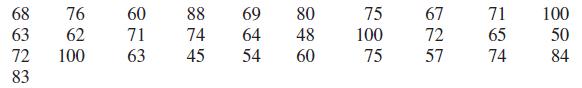
Data from Example 4.9
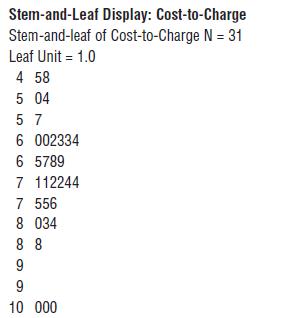
The Oregon Department of Health Services publishes cost-to-charge ratios for hospitals in Oregon on its web site. The cost-to-charge ratio is computed as the ratio of the actual cost of care to what the hospital actually bills for care, and the ratio is usually expressed as a percentage. A cost-to-charge ratio of 60% means that the actual cost is 60% of what was billed. The ratios for inpatient services in 2002 at 31 hospitals in Oregon were:
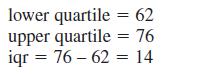
The sample size n = 31 is an odd number, so the median is excluded from both halves of the sample when computing the quartiles.
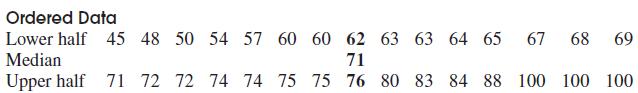
Each half of the sample contains 15 observations. The lower quartile is just the median of the lower half of the sample (62 for this data set), and the upper quartile is the median of the upper half (76 for this data set). This gives
The sample mean and standard deviation for this data set are 70.65 and 14.11, respectively. If we were to change the two smallest values from 45 and 48 to 25 and 28 (so that they still remain the two smallest values), the median and interquartile range would not be affected, whereas the mean and the standard deviation would change to 69.35 and 16.99, respectively.
Step by Step Answer:
The data set provided for the 10 hospitals in California with the lowest costtocharge ratios assuming that these are the percentages are as follows 88...View the full answer


Introduction To Statistics And Data Analysis
ISBN: 9780495118732
3rd Edition
Authors: Roxy Peck, Chris Olsen, Jay L. Devore
