

Ten measurements of the steam rate (in pounds per hour) of a distillation tower were used to
Question:
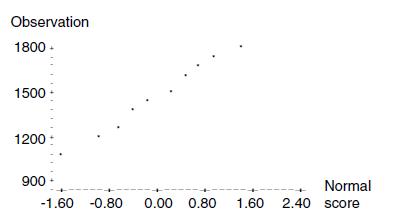
Ten measurements of the steam rate (in pounds per hour) of a distillation tower were used to construct the following normal probability plot (“A Self-Descaling Distillation Tower,” Chemical Engineering Process [1968]: 79–84). Based on the plot, do you think it is reasonable to assume that the normal distribution provides an adequate description of the steam rate distribution? Explain.
Fantastic news! We've Found the answer you've been seeking!
Step by Step Answer:
To determine whether the normal distribution provides an adequate description of the steam rate distribution we need to analyze the given normal proba...View the full answer

Answered By
Akash M Rathod
I have been utilized by educators and students alike to provide individualized assistance with everything from grammar and vocabulary to complex problem-solving in various academic subjects. I can provide explanations, examples, and practice exercises tailored to each student's individual needs, helping them to grasp difficult concepts and improve their skills.
My tutoring sessions are interactive and engaging, utilizing a variety of tools and resources to keep learners motivated and focused. Whether a student needs help with homework, test preparation, or simply wants to improve their skills in a particular subject area, I am equipped to provide the support and guidance they need to succeed.
0 Reviews
10+ Question Solved
Related Book For 

Introduction To Statistics And Data Analysis
ISBN: 9780495118732
3rd Edition
Authors: Roxy Peck, Chris Olsen, Jay L. Devore
Question Posted:
