

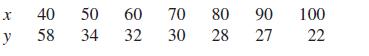
The following data on x = soil depth (in centimeters) and y = percentage of montmorillonite in
Question:
The following data on x = soil depth (in centimeters) and y = percentage of montmorillonite in the soil were taken from a scatterplot in the paper “Ancient Maya Drained Field Agriculture: Its Possible Application Today in the New River Floodplain, Belize, C.A.” (Agricultural Ecosystems and Environment [1984]: 67–84):
a. Draw a scatterplot of y versus x.
b. The equation of the least-squares line is ŷ = 64.50 − 0.45x. Draw this line on your scatterplot. Do there appear to be any large residuals?
c. Compute the residuals, and construct a residual plot. Are there any unusual features in the plot?
Fantastic news! We've Found the answer you've been seeking!
Step by Step Answer:
Unfortunately I cannot create visual content such as scatterplots or residual plots However I can guide you through the process of how you would creat...View the full answer

Answered By
Ali Khawaja
my expertise are as follows: financial accounting : - journal entries - financial statements including balance sheet, profit & loss account, cash flow statement & statement of changes in equity -consolidated statement of financial position. -ratio analysis -depreciation methods -accounting concepts -understanding and application of all international financial reporting standards (ifrs) -international accounting standards (ias) -etc business analysis : -business strategy -strategic choices -business processes -e-business -e-marketing -project management -finance -hrm financial management : -project appraisal -capital budgeting -net present value (npv) -internal rate of return (irr) -net present value(npv) -payback period -strategic position -strategic choices -information technology -project management -finance -human resource management auditing: -internal audit -external audit -substantive procedures -analytic procedures -designing and assessment of internal controls -developing the flow charts & data flow diagrams -audit reports -engagement letter -materiality economics: -micro -macro -game theory -econometric -mathematical application in economics -empirical macroeconomics -international trade -international political economy -monetary theory and policy -public economics ,business law, and all regarding commerce
1+ Reviews
10+ Question Solved
Related Book For 

Introduction To Statistics And Data Analysis
ISBN: 9780495118732
3rd Edition
Authors: Roxy Peck, Chris Olsen, Jay L. Devore
Question Posted:
