

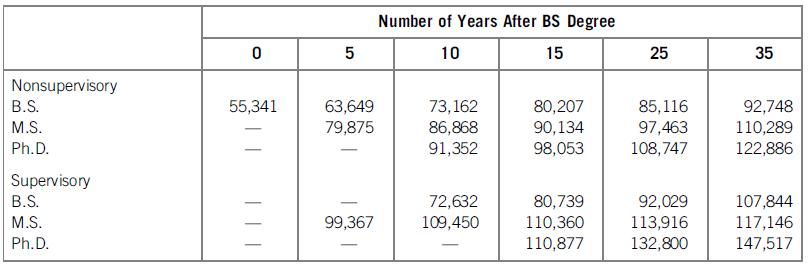
Question: Using the technique introduced in Example 3.8, create a spreadsheet graph of the following data for the median annual salaries in dollars for engineers based
Using the technique introduced in Example 3.8, create a spreadsheet graph of the following data for the median annual salaries in dollars for engineers based on years of experience, supervisory responsibility, and level of education.
Example 3.8
Number of Years After BS Degree 10 15 25 35 Nonsupervisory B.S. 55,341 63,649 73,162 86,868 80,207 85,116 97,463 108,747 92,748 110,289 122,886 M.S. 79,875 90,134 Ph.D. 91,352 98,053 Supervisory B.S. 72,632 107,844 80,739 110,360 110,877 92,029 113,916 132,800 M.S. 99,367 109,450 117,146 Ph.D. 147,517
Step by Step Solution
3.51 Rating (178 Votes )
There are 3 Steps involved in it
To create a spreadsheet graph of the median annual salaries for engineers based on the provided data ... View full answer

Get step-by-step solutions from verified subject matter experts