

The table shows values of variables V and P. a. By plotting a suitable straight-line graph, show
Question:
The table shows values of variables V and P.
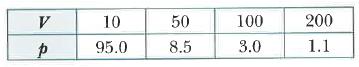
a. By plotting a suitable straight-line graph, show that V and P are related by the equation P = kVn, where k and n are constants.
Use your graph to find
b. The value of n,
c. The value of P when V = 35.
Fantastic news! We've Found the answer you've been seeking!
Step by Step Answer:
ANSWER To determine if the variables V and P are related by the equation P kVn we can plot a graph o...View the full answer

Answered By
Surendar Kumaradevan
I have worked with both teachers and students to offer specialized help with everything from grammar and vocabulary to challenging problem-solving in a range of academic disciplines. For each student's specific needs, I can offer explanations, examples, and practice tasks that will help them better understand complex ideas and develop their skills.
I employ a range of techniques and resources in my engaged, interesting tutoring sessions to keep students motivated and on task. I have the tools necessary to offer students the support and direction they require in order to achieve, whether they need assistance with their homework, test preparation, or simply want to hone their skills in a particular subject area.
0 Reviews
10+ Question Solved
Related Book For 
Cambridge IGCSE And O Level Additional Mathematics Coursebook
ISBN: 9781108411660
2nd Edition
Authors: Sue Pemberton
Question Posted:
