

Question: Start with the partial model in the file Ch07 P15 Build a Model.xls on the textbook's website. The file contains hypothetical data for working this
Start with the partial model in the file Ch07 P15 Build a Model.xls on the textbook's website. The file contains hypothetical data for working this problem. Goodman Industries's and Landry Incorporated's stock prices and dividends, along with the Market Index, are shown below. Stock prices are reported for December 31 of each year, and dividends reflect those paid during the year. The market data are adjusted to include dividends.
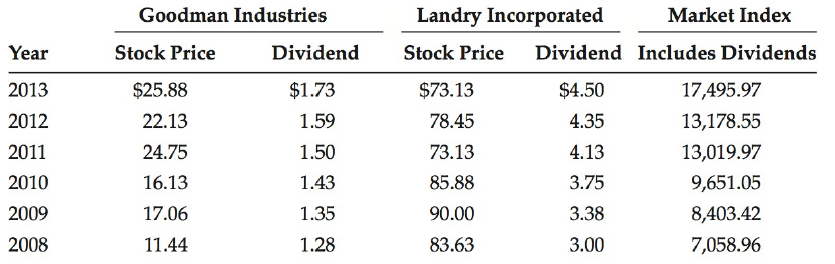
a. Use the data given to calculate annual returns for Goodman, Landry, and the Market Index, and then calculate average annual returns for the two stocks and the index.
b. Calculate the standard deviations of the returns for Goodman, Landry, and the Market Index.
c. Construct a scatter diagram graph that shows Goodman's returns on the vertical axis and the Market Index's returns on the horizontal axis. Construct a similar graph showing Landry's stock returns on the vertical axis.
d. Estimate Goodman's and Landry's betas as the slopes of regression lines with stock return on the vertical axis (y-axis) and market return on the horizontal axis (x-axis). Are these betas consistent with your graph?
e. The risk-free rate on long-term Treasury bonds is 6.04%. Assume that the market risk premium is 5%. What is the required return on the market? Now use the SML equation to calculate the two companies' required returns.
f. If you formed a portfolio that consisted of 50% Goodman stock and 50% Landry stock, what would be its beta and its required return?
g. Suppose an investor wants to include some Goodman Industries stock in his portfolio. Stocks A, B, and C are currently in the portfolio, and their betas are 0.769, 0.985, and 1.423, respectively. Calculate the new portfolio's required return if it consists of 25% Goodman, 15% Stock A, 40% Stock B, and 20% Stock C.
Goodman Industries Market Index Includes Dividends Landry Incorporated Year Stock Price Dividend Stock Price Dividend 17,495.97 $73.13 $25.88 $1.73 1.59 $4.50 4.35 2013 2012 78.45 22.13 13,178.55 4.13 73.13 2011 24.75 1.50 13,019.97 1.43 2010 16.13 85.88 3.75 9,651.05 3.38 1.35 2009 17.06 90.00 8,403.42 1.28 11.44 7,058.96 2008 83.63 3.00
Step by Step Solution
3.31 Rating (160 Votes )
There are 3 Steps involved in it
a Data as given in the problem are shown below Goodman Industries Landry Incorporated Market Index Year Stock Price Dividend Stock Price Dividend Includes Divs 2013 2588 173 7313 450 1749597 2012 2213 ... View full answer

Get step-by-step solutions from verified subject matter experts
Document Format (1 attachment)
1919_604876ffd0e25_784793.xlsx
300 KBs Excel File