

Start with the partial model in the file Ch02 P15 Build a Model.xlsx on the textbooks Web
Question:
Start with the partial model in the file Ch02 P15 Build a Model.xlsx on the textbook’s Web site. The file contains hypothetical data for working this problem. Goodman Corporation’s and Landry Incorporated’s stock prices and dividends, along with the Market Index, are shown here. Stock prices are reported for December 31 of each year, and dividends reflect those paid during the year. The market data are adjusted to include dividends.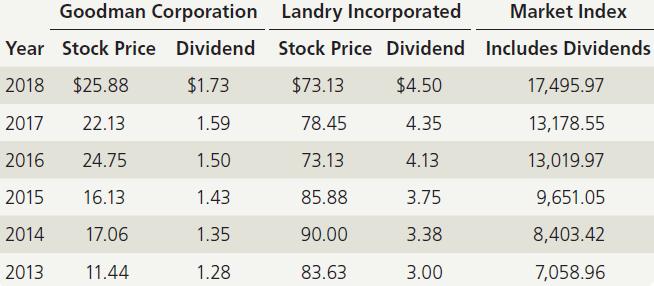
a. Use the data given to calculate annual returns for Goodman, Landry, and the Market Index, and then calculate average annual returns for the two stocks and the index.
b. Calculate the standard deviations of the returns for Goodman, Landry, and the Market Index.
c. Construct a scatter diagram graph that shows Goodman’s returns on the vertical axis and the Market Index’s returns on the horizontal axis. Construct a similar graph showing Landry’s stock returns on the vertical axis.
d. Estimate Goodman’s and Landry’s betas as the slopes of regression lines with stock return on the vertical axis (y-axis) and market return on the horizontal axis (x-axis).
Step by Step Answer:

This question has not been answered yet.
You can Ask your question!


Intermediate Financial Management
ISBN: 9781337395083
13th Edition
Authors: Eugene F. Brigham, Phillip R. Daves
