

Question: Why does net working capital appear with both negative and positive values in Figure 13-2? FIGURE 13-2 Analysis of an Expansion Project: Cash Flows and
Why does net working capital appear with both negative and positive values in Figure 13-2?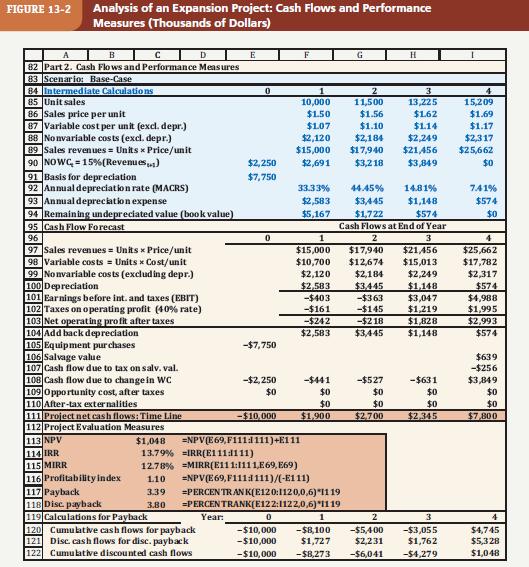
FIGURE 13-2 Analysis of an Expansion Project: Cash Flows and Performance Measures (Thousands of Dollars) B C D E F G H 82 Part 2. Cash Flows and Performance Measures 83 Scenario: Base-Case 84 Intermediate Calculations 0 1 2 3 4 85 Unit sales 86 Sales price per unit 87 Variable cost per unit (excl. depr.) 10,000 11,500 13,225 15,209 $1.50 $1.56 $1.62 $1.69 $1.07 $1.10 $1.14 $1.17 88 Nonvariable costs (excl. depr.) $2,120 $2,184 $2,249 $2,317 89 Sales revenues Units x Price/unit $15,000 $17,940 $21,456 $25,662 90 NOWC-15% (Revenues...) $2,250 $2,691 $3,218 $3,849 $0 91 Basis for depreciation $7,750 92 Annual depreciation rate (MACRS) 33.33% 44.45% 14.81% 7.41% 93 Annual depreciation expense $2,583 $3,445 $1,148 $574 94 Remaining undepreciated value (book value) $5,167 $1,722 $574 $0 95 Cash Flow Forecast Cash Flows at End of Year 96 97 Sales revenues= Units Price/unit 0 1 2 $15,000 $17,940 3 $21,456 4 $25,662 98 Variable costs = Units Cost/unit $10,700 $12,674 $15,013 $17,782 103 Net operating profit after taxes 99 Nonvariable costs (excluding depr.) 100 Depreciation 101 Earnings before int. and taxes (EBIT) 102 Taxes on operating profit (40% rate) 104 Add back depreciation $2,120 $2,184 $2,249 $2,317 $2,583 $3,445 $1,148 $574 -$403 -$363 $3,047 $4,988 -$161 -$145 $1,219 $1,995 -$242 -$218 $1,828 $2,993 $2,583 $3,445 $1,148 $574 105 Equipment purchases -$7,750 106 Salvage value $639 107 Cash flow due to tax on salv. val. -$256 108 Cash flow due to change in WC -$2,250 -$441 -$527 -$631 $3,849 109 Opportunity cost, after taxes 110 After-tax externalities 111 Project net cash flows: Time Line 112 Project Evaluation Measures $0 $0 $0 $0 $0 $0 $0 $0 $0 -$10,000 $1,900 $2,700 $2,345 $7,800 113 NPV $1,048 =NPV(E69,F111:1111)+E111 114 IRR 13.79% IRR(E1111111) 115 MIRR 12.78% MIRR(E111:1111,E69,E69) 116 Profitability index 1.10 =NPV(E69,F111111)/(-E111) 117 Payback 3.39 =PERCENTRAN K(E120:1120,0,6)*1119 118 Disc. payback 3.80 =PERCENTRANK(E122:1122,0,6)*1119 119 Calculations for Payback 120 Cumulative cash flows for payback 121 Disc. cash flows for disc. payback 122 Cumulative discounted cash flows Year: 0 1 2 3 4 -$10,000 -$8,100 -$10,000 $1,727 -$10,000 -$8,273 -$5,400 -$3,055 $4,745 $2,231 $1,762 $5,328 -$6,041 -$4,279 $1,048
Step by Step Solution
3.37 Rating (144 Votes )
There are 3 Steps involved in it

Get step-by-step solutions from verified subject matter experts