

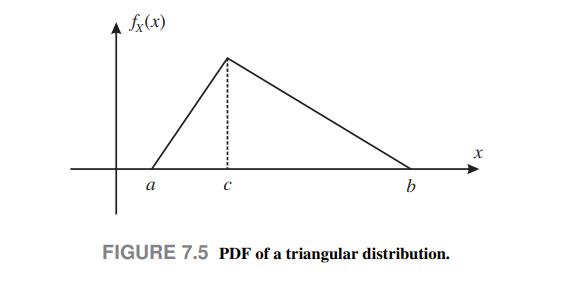
Figure 7.5 shows the probability density function (PDF) of a generic triangular distribution with support (left(begin{array}{ll}a, &
Question:
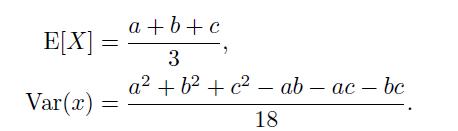
Figure 7.5 shows the probability density function (PDF) of a generic triangular distribution with support \(\left(\begin{array}{ll}a, & b\end{array}\right)\) and mode \(c\). For such a distribution, expected value and variance are given by the following formulas:
Say that the profit from a financial portfolio, with a holding period of a few weeks, has a triangular distribution with parameters (in €) \(a=75,000, b=\) 55,000 , and \(c=40,000\), so that the maximum possible loss is \(€ 75,000\). Find \(\mathrm{V} @ \mathrm{R}\) at level \(95 \%\).The drawing of Fig. 7.5 is not in scale and is just meant as a qualitative hint.
Data From Figure 7.5
Fantastic news! We've Found the answer you've been seeking!
Step by Step Answer:

Answered By
ZIPPORAH KISIO LUNGI
I have worked on several other sites for more than five years, and I always handle clients work with due diligence and professionalism. Am versed with adequate experience in the fields mentioned above in which have delivered quality papers in research, thesis, essays, blog articles, and so forth.
I have gained extensive experience in assisting students to acquire top grades in biological, business and IT papers. Notwithstanding that, I have 7+ years of experience in corporate world software design and development.
194+ Reviews
341+ Question Solved
Related Book For 
An Introduction To Financial Markets A Quantitative Approach
ISBN: 9781118014776
1st Edition
Authors: Paolo Brandimarte
Question Posted:
