

Question: The ordered mean difference (OMD) was developed* as a technique in performance measurement that measures how well a given funds return does against a benchmark
The ordered mean difference (OMD) was developed* as a technique in performance measurement that measures how well a given fund’s return does against a benchmark return. Essentially, it captures the insight of the song
“Whatever you can do, I can do better,” from Rodgers and Hammerstein’s Annie Get Your Gun (Feel free to hum along.) The following Excel exercise utilizes the menu tools and wizards.
(i) Take one of the stocks in the disk. Tabulate the returns on the stock together with the return on the market at the same date. Now reorder the observations according to increasing values of the benchmark. Next, compute the running mean of the differences, which is the progressive moving average as you move down. The table below illustrates the calculation. You end up with a function that you can plot against the benchmark return (OMD as a function of R).
(ii) If the OMD function lies wholly above the horizontal axis (all values are positive) this means that your chosen stock (or fund, etc.) is dominant over the benchmark (market, in this case). Sell the market and buy the stock.
More commonly, in a group of stocks (such as the ones on your data disk)
some will have OMD schedules that slope upwards (aggressive) others that slope downwards (defensive). If the CAPM hypothesis is correct, all should cross the horizontal axis at the same point. Test the CAPM using the stocks from your data disk by plotting all their OMD schedules on the same diagram.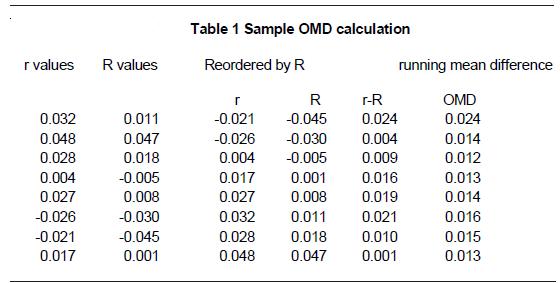
r values R values Table 1 Sample OMD calculation Reordered by R running mean difference R r-R OMD 0.032 0.011 -0.021 -0.045 0.024 0.024 0.048 0.047 -0.026 -0.030 0.004 0.014 0.028 0.018 0.004 -0.005 0.009 0.012 0.004 -0.005 0.017 0.001 0.016 0.013 0.027 0.008 0.027 0.008 0.019 0.014 -0.026 -0.030 0.032 0.011 0.021 0.016 -0.021 -0.045 0.028 0.018 0.010 0.015 0.017 0.001 0.048 0.047 0.001 0.013
Step by Step Solution
There are 3 Steps involved in it

Get step-by-step solutions from verified subject matter experts