

Question: Selected data for The Hershey Company for Year 1 through Year 3 appear in Exhibit 4.29. REQUIRED a. Compute ROA and its decomposition for Year
Selected data for The Hershey Company for Year 1 through Year 3 appear in Exhibit 4.29.
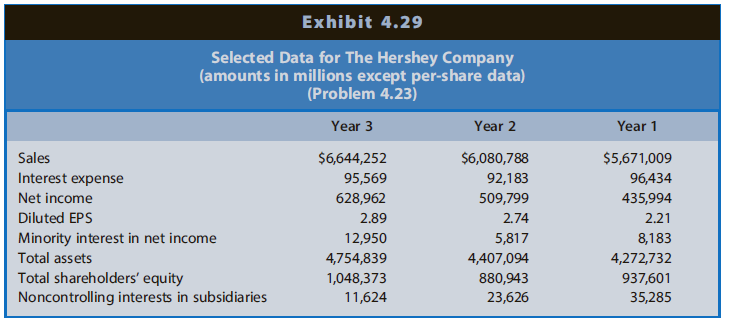
REQUIREDa. Compute ROA and its decomposition for Year 2 and Year 3. Assume a tax rate of 35%.b. Compute ROCE and its decomposition for Year 2 and Year 3.c. Interpret the trends in reported net income, EPS, ROA, and ROCE over the three-year period.
Exhibit 4.29 Selected Data for The Hershey Company (amounts in millions except per-share data) (Problem 4.23) Year 3 Year 2 Year 1 Sales $6,644,252 $6,080,788 $5,671,009 Interest expense 95,569 92,183 96,434 Net income 628,962 509,799 435,994 Diluted EPS 2.89 2.74 2.21 Minority interest in net income 12,950 5,817 8,183 Total assets 4,754,839 4,407,094 4,272,732 Total shareholders' equity Noncontrolling interests in subsidiaries 937,601 35,285 1,048,373 880,943 11,624 23,626
Step by Step Solution
3.48 Rating (155 Votes )
There are 3 Steps involved in it
a Profit Margin for ROA Year 3 660931 1 03595569 129506644252 111 Year 2 628962 1 03592183 581760807... View full answer

Get step-by-step solutions from verified subject matter experts