

Question: Frizell Company has the following comparative balance sheet data. Additional information for 2017: 1. Net income was $25,000. 2. Sales on account were $410,000. Sales
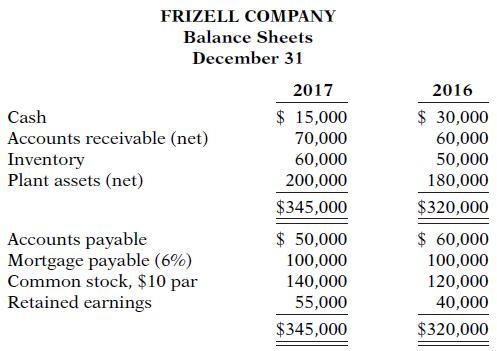
Frizell Company has the following comparative balance sheet data.
Additional information for 2017:
1. Net income was $25,000.
2. Sales on account were $410,000. Sales returns and allowances were $20,000.
3. Cost of goods sold was $198,000.
Instructions
Compute the following ratios at December 31, 2017.
(a) Current ratio.
(b) Acid-test ratio.
(c) Accounts receivable turnover.
(d) Inventory turnover.
FRIZELL COMPANY Balance Sheets December 31 2017 2016 $ 15,000 $ 30,000 60,000 50,000 Cash Accounts receivable (net) Inventory Plant assets (net) 70,000 60,000 200,000 180,000 $345,000 $320,000 $ 50,000 100,000 140,000 55,000 $ 60,000 Accounts payable Mortgage payable (6%) Common stock, $10 par Retained earnings 100,000 120,000 40,000 $345,000 $320,000
Step by Step Solution
3.49 Rating (156 Votes )
There are 3 Steps involved in it
a Current ratioCurrent AssetsCurrent Liabilities1500070000600005000014500050000291 b Acid Test r... View full answer

Get step-by-step solutions from verified subject matter experts
Document Format (2 attachments)
426_61d57f260a462_827111.pdf
180 KBs PDF File
426_61d57f260a462_827111.docx
120 KBs Word File