

Question: Selected comparative statement data for Queen Products Company are presented below. All balance sheet data are as of December 31. Instructions Compute the following ratios
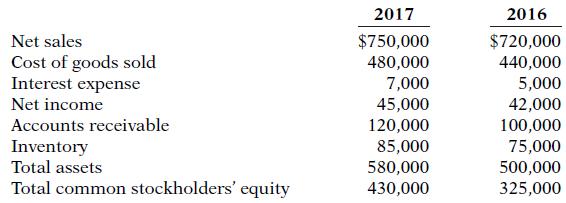
Selected comparative statement data for Queen Products Company are presented below. All balance sheet data are as of December 31.
Instructions
Compute the following ratios for 2017.
(a) Profit margin.
(b) Asset turnover.
(c) Return on assets.
(d) Return on common stockholders’ equity.
2017 2016 $750,000 480,000 Net sales $720,000 Cost of goods sold Interest expense 7,000 45,000 120,000 85,000 580,000 430,000 440,000 5,000 42,000 100,000 75,000 500,000 325,000 Net income Accounts receivable Inventory Total assets Total common stockholders' equity
Step by Step Solution
3.42 Rating (165 Votes )
There are 3 Steps involved in it
a Profit margin Net Income Net Profits Net Sales 45000750000 6 b As... View full answer

Get step-by-step solutions from verified subject matter experts
Document Format (2 attachments)
426_61d57f260a512_827112.pdf
180 KBs PDF File
426_61d57f260a512_827112.docx
120 KBs Word File