

Question: The data in Table 12 has been tabulated for every minute of the (60-minute) rush hour. What percentage of the time is the waiting line
The data in Table 12 has been tabulated for every minute of the (60-minute) rush hour. What percentage of the time is the waiting line 4 or more cars?
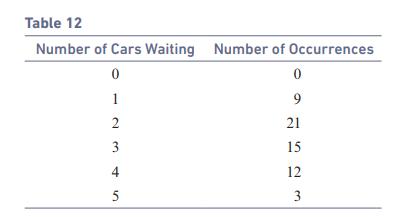
Table 12 Number of Cars Waiting Number of Occurrences 0 1 2 3 4 5 0 9 21 15 12 3
Step by Step Solution
★★★★★
3.38 Rating (191 Votes )
There are 3 Steps involved in it
1 Expert Approved Answer
Step: 1 Unlock

Percentage of ... View full answer
Question Has Been Solved by an Expert!
Get step-by-step solutions from verified subject matter experts
Step: 2 Unlock
Step: 3 Unlock