

Question: (a) Census data for the United States between 1790 and 1950 are given in the following table. Construct a logistic population model using the data
(b) Construct a table comparing actual census population withthe population predicted by the model in part (a). Compute the error and the percentage error for each entry pair.
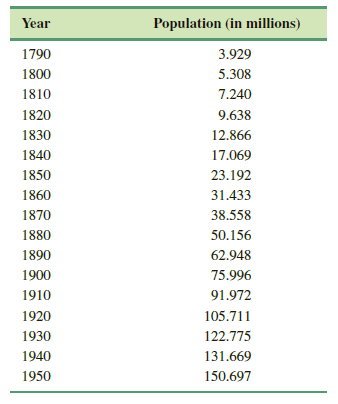
Year Population (in millions) 1790 3.929 1800 5.308 1810 7.240 9.638 1820 1830 12.866 1840 17.069 23.192 1850 31.433 1860 38.558 1870 1880 50.156 1890 62.948 75.996 1900 1910 91.972 1920 105.711 1930 122.775 131.669 1940 1950 150.697
Step by Step Solution
3.42 Rating (168 Votes )
There are 3 Steps involved in it
a We have dPdt PabP with P0 3929 million Using separation of variables we obtain Pt 3929a3929b a 392... View full answer

Get step-by-step solutions from verified subject matter experts
Document Format (2 attachments)
1596_6062c74d02ea3_676463.pdf
180 KBs PDF File
1596_6062c74d02ea3_676463.docx
120 KBs Word File