

Consider a cross-sectional slice through an array of heat exchanger tubes (Fig. P434C). For each desired piece
Question:
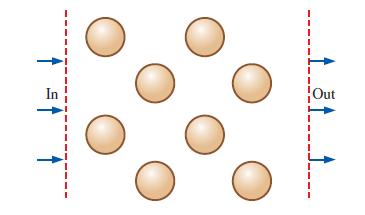
Consider a cross-sectional slice through an array of heat exchanger tubes (Fig. P4–34C). For each desired piece of information, choose which kind of flow visualization plot (vector plot or contour plot) would be most appropriate, and explain why.
(a) The location of maximum fluid speed is to be visualized.
(b) Flow separation at the rear of the tubes is to be visualized.
(c) The temperature field throughout the plane is to be visualized.
(d) The distribution of the vorticity component normal to the plane is to be visualized.
Fantastic news! We've Found the answer you've been seeking!
Step by Step Answer:
a The location of maximum fluid speed is to be visualized A vector plot would be most appropriate for visualizing the location of maximum fluid speed ...View the full answer

Answered By
User l_998468
I have extensive tutoring experience, having worked as a private tutor for over three years. I have tutored students from different academic levels, including high school, undergraduate, and graduate levels. My tutoring experience has taught me to be patient, attentive to student needs, and effective in communicating difficult concepts in simple terms.
I have a strong background in statistics, probability theory, data analysis, and data visualization. I am proficient in using statistical software such as R, Python, and SPSS, which are commonly used in academic research and data analysis. Additionally, I have excellent communication and interpersonal skills, which enable me to establish rapport with students, understand their learning styles, and adapt my teaching approach to meet their needs.
I am passionate about teaching and helping students achieve their academic goals.
0 Reviews
10+ Question Solved
Related Book For 
Fluid Mechanics Fundamentals And Applications
ISBN: 9780073380322
3rd Edition
Authors: Yunus Cengel, John Cimbala
Question Posted:
