

Question: Suppose a national survey of women was conducted in the years 1972, 1974, 1976, 1978, 1980, 1982, and 1984. Suppose the survey data from
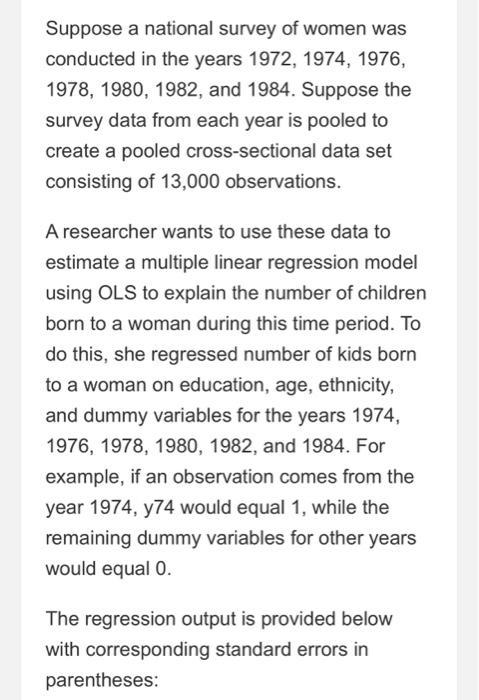
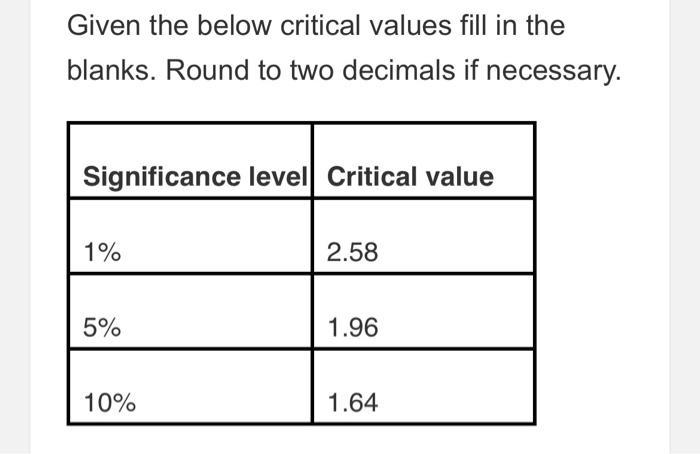
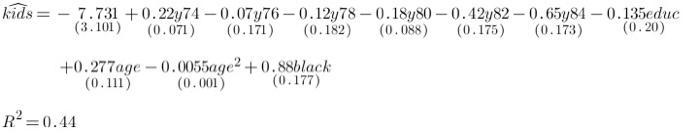
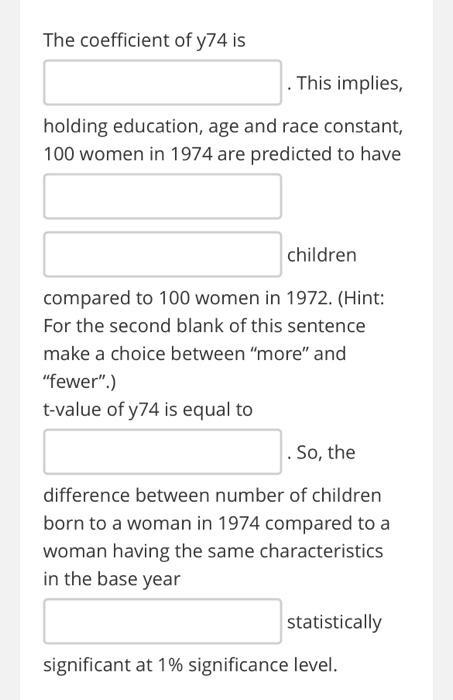
Suppose a national survey of women was conducted in the years 1972, 1974, 1976, 1978, 1980, 1982, and 1984. Suppose the survey data from each year is pooled to create a pooled cross-sectional data set consisting of 13,000 observations. A researcher wants to use these data to estimate a multiple linear regression model using OLS to explain the number of children born to a woman during this time period. To do this, she regressed number of kids born to a woman on education, age, ethnicity, and dummy variables for the years 1974, 1976, 1978, 1980, 1982, and 1984. For example, if an observation comes from the year 1974, y74 would equal 1, while the remaining dummy variables for other years would equal 0. The regression output is provided below with corresponding standard errors in parentheses: Given the below critical values fill in the blanks. Round to two decimals if necessary. Significance level Critical value 1% 5% 10% 2.58 1.96 1.64 kids= 7.731 +0.22y74-0.07y76-0.12y78-0.18y80-0.42y82-0.65y84 -0.135educ (3.101) (0.071) (0.171) (0.182) (0.088) (0.175) (0.173) (0.20) +0.277age-0.0055age2 +0.88black (0.177) R=0.44 (0.111) (0.001) The coefficient of y74 is . This implies, holding education, age and race constant, 100 women in 1974 are predicted to have children compared to 100 women in 1972. (Hint: For the second blank of this sentence make a choice between "more" and "fewer".) t-value of y74 is equal to . So, the difference between number of children born to a woman in 1974 compared to a woman having the same characteristics in the base year statistically significant at 1% significance level.
Step by Step Solution
3.47 Rating (163 Votes )
There are 3 Steps involved in it

Get step-by-step solutions from verified subject matter experts