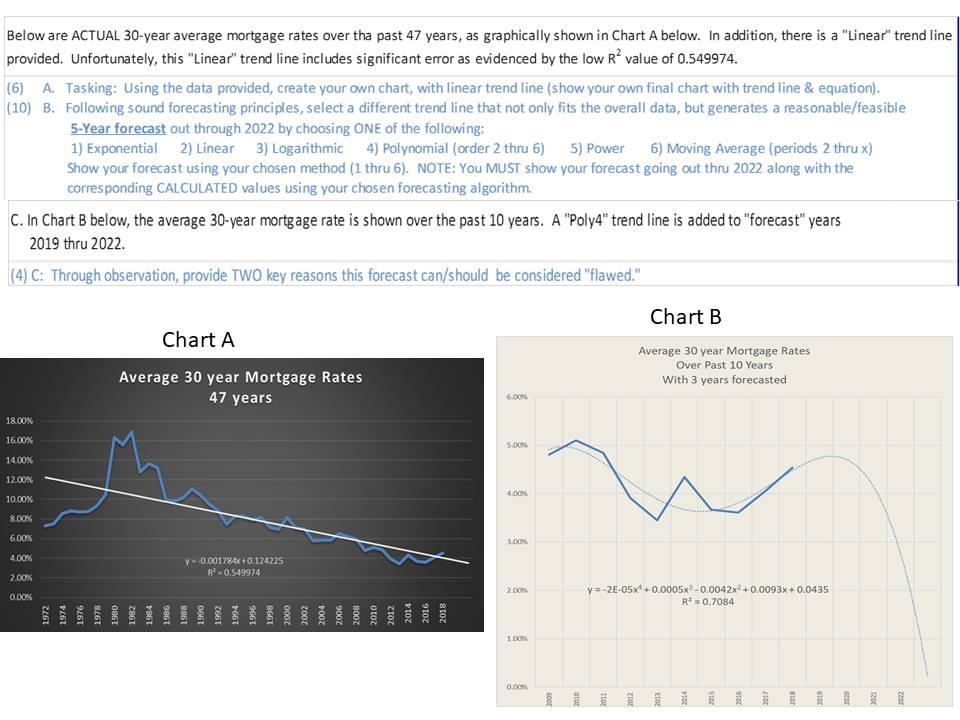
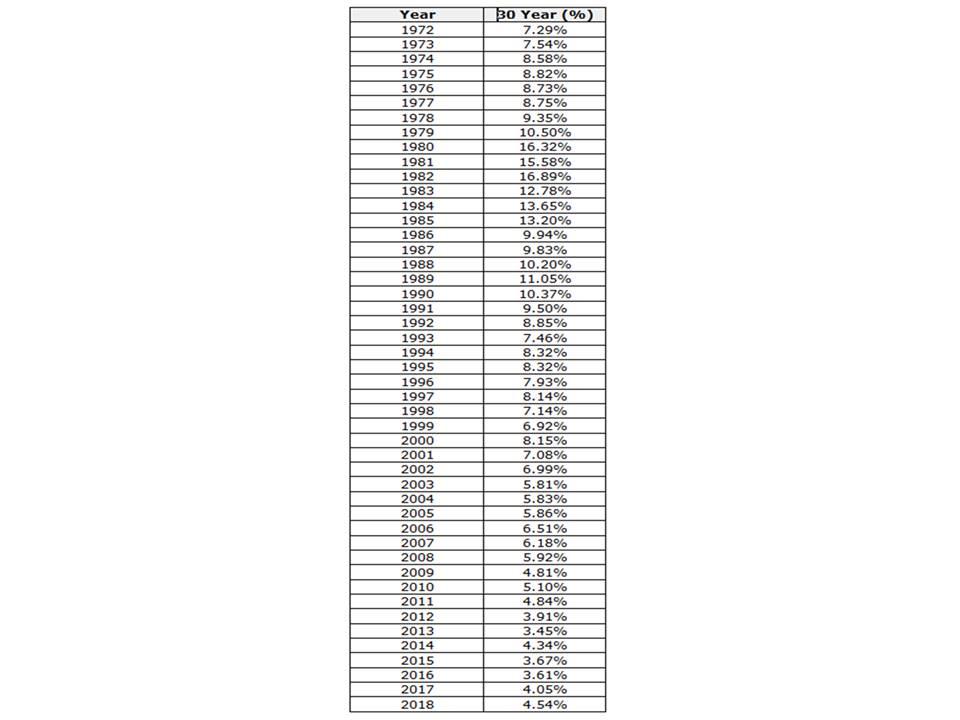
Question: Please show step by step Below are ACTUAL 30-year average mortgage rates over tha past 47 years, as graphically shown in Chart A below. In

Please show step by step

Please show step by step Below are ACTUAL 30-yearPlease show step by step Below are ACTUAL 30-year

Below are ACTUAL 30-year average mortgage rates over tha past 47 years, as graphically shown in Chart A below. In addition, there is a "Linear" trend line provided. Unfortunately, this "Linear" trend line includes significant error as evidenced by the low R" value of 0.549974. (6) A. Tasking: Using the data provided, create your own chart, with linear trend line (show your own final chart with trend line & equation), (10) B. Following sound forecasting principles, select a different trend line that not only fits the overall data, but generates a reasonable/feasible 5-Year forecast out through 2022 by choosing ONE of the following: 1) Exponential 2) Linear 3) Logarithmic 4) Polynomial (order 2 thru 6) 5) Power 6) Moving Average (periods 2 thru x) Show your forecast using your chosen method (1 thru 6). NOTE: You MUST show your forecast going out thru 2022 along with the corresponding CALCULATED values using your chosen forecasting algorithm. C. In Chart B below, the average 30-year mortgage rate is shown over the past 10 years. A "Poly4" trend line is added to "forecast" years 2019 thru 2022. (4) C: Through observation, provide TWO key reasons this forecast can/should be considered "Flawed." Chart B Chart A Average 30 year Mortgage Rates Over Past 10 Years With 3 years forecasted Average 30 year Mortgage Rates 47 years 6.00% 18.00% 16.00% 5.00% 14.00% 12.00% 4.00 10.00% 8.00% 6.00% 3.00 4.00% y =-0.00178AX +0.124225 R 0.549974 2.00% 2.00% 0.00% y = -28-05** +0.0005x?-0.0042x +0.0093x + 0.0435 R* = 0.7084 1972 1974 1976 1978 0861 1982 1984 1986 8861 0661 2661 1667 1996 8667 2000 2002 POOZ 2006 2008 2010 100% 0.00% Year 1972 1973 1974 1975 1976 1977 1978 1979 1980 1981 1982 1983 1984 1985 1986 1987 1988 1989 1990 1991 1992 1993 1994 1995 1996 1997 1998 1999 2000 2001 2002 2003 2004 2005 2006 2007 2008 2009 2010 2011 2012 2013 2014 2015 2016 2017 2018 30 Year (%) 7.29% 7.54% 8.58% 8.82% 8.73% 8.75% 9.35% 10.50% 16.32% 15.58% 16.89% 12.78% 13.65% 13.20% 9.94% 9.83% 10.20% 11.05% 10.37% 9.50% 8.85% 7.46% 8.32% 8.32% 7.93% 8.14% 7.14% 6.92% 8.15% 7.08% 6.99% 5.81% 5.83% 5.86% 6.51% 6.18% 5.92% 4.81% 5.10% 4.84% 3.91% 3.45% 4.34% 3.67% 3.61% 4.05% 4.54%

Step by Step Solution

There are 3 Steps involved in it

1 Expert Approved Answer
Step: 1 Unlock blur-text-image
Question Has Been Solved by an Expert!

Get step-by-step solutions from verified subject matter experts

Step: 2 Unlock
Step: 3 Unlock

Students Have Also Explored These Related General Management Questions!