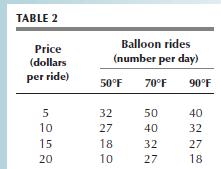
Table 2 provides data on the price of a balloon ride, the temperature, and the number of
Question:
Table 2 provides data on the price of a balloon ride, the temperature, and the number of rides a day. Draw graphs to show the relationship between
• The price and the number of rides, when the temperature is 70°F.
• The number of rides and the temperature, when the price is $15 a ride.
Table 2

Transcribed Image Text:
TABLE 2 Price (dollars per ride) 5 10 15 20 Balloon rides (number per day) 70F 50F 32 27 18 10 50 40 32 27 90F 40 32 27 18
Step by Step Answer:

This question has not been answered yet.
You can Ask your question!
Related Book For 

Question Posted:
Students also viewed these Business questions
-
The table provides data on the price of a balloon ride, the temperature, and the number of rides a day. Draw graphs to show the relationship between The price and the number of rides, when the...
-
Use the following table to work Problems . The table gives the price of a balloon ride, the temperature, and the number of rides a day. What happens in the graph in Problem 10 if the temperature...
-
Use the following table to work Problems . The table gives the price of a balloon ride, the temperature, and the number of rides a day. Draw a graph to show the relationship between the price and the...
-
Implement the method contains() for HashST.
-
Write a draft problem statement for your dissertation research. Write a draft purpose statement for your dissertation. Describe your preferred research method (quan/qual/mixed). Describe potential...
-
Name four states that do not have an employee income tax.
-
A chemist has seven light objects to weigh on a balance pan scale. The standard deviation of each weighing is denoted by $\sigma$. In a 1935 paper, Frank Yates [Yates, 1935] suggested an improved...
-
Paisley Company prepared the following statement of cash flows for the current year: Required: Compute Paisley Companys free cash flow for the currentyear. Paisley Company Statement of Cash Flows-...
-
Weighted Average Shares At the beginning of 2 0 1 9 , Hardin Company had 3 4 0 , 0 0 0 shares of $ 1 0 par common stock outstanding. During the year, it engaged in the following transactions related...
-
Draw a scatter diagram to show the relationship between quantities sold of music videos and singles downloads. Describe the relationship. Use the following information in Table 1 to work Problems 1...
-
Draw a time-series graph of the quantity of compact discs sold. Say in which year or years the quantity sold (a) was highest, (b) was lowest, (c) increased the most, and (d) decreased the most. If...
-
Hayhoe, Leach, Turner, Bruin, and Lawrence (2000) investigated differences between men and women college students with respect to their credit card use. Research participants completed a...
-
Show that: (e) (pq)^(qr) (pr) is a tautology. (1 point) (f) (pq) r and p(qr) are not logically equivalent. (1 point) (g) pq and p q are logically equivalent. (2 points) (h) (p q)v (pr) and p (qvr)...
-
1. We have two different code sequences. The table bellow shows the instruction counts for each instruction class. The CPI's for each instruction class are 4, 3, 2, and 1, respectively. a. What is...
-
You are to write a VBA problem that converts from mass fractions to mole fractions. Your program should also calculate the molar average heat capacity. Note that the average heat capacity is simply...
-
Develop a Ruby script that parses a log file and extracts relevant information. Implement a class that models a bookstore inventory with methods for adding, updating, and searching books. Write a...
-
3. Find the answer by MATLAB using the minimum number of parentheses, where x=2, y=3, z=4 a. x+ 2-1 2 x+ y b. y+3z ecos(2x)+1+2x C. In(x+1)+2 1 d. tan' (xtan(x3)) -X+ x-4yz e. 2y f. cos(2x+1)+2 3x-4...
-
During its first year of operations, Sugarsmooth, Inc. produced 55,000 jars of hand cream based on a formula containing 10 percent glycolic acid. Unit sales were 53,500 jars. Fixed overhead totaled...
-
Synthesize the products by drawing out reagents and intermediates along the way. `N H. OH HO HO
-
Explain what an anti dumping tariff is. What argument might U.S. steelmakers use to get the government to raise the tariff on steel imports? U.S. steelmakers seek antidumping action, steelmakers want...
-
What is dumping? Who in the United States loses from Chinas dumping of steel? U.S. steelmakers seek anti dumping action, steelmakers want the United States to put restrictions on imports from five...
-
Explain who in the United States gains and who loses from restrictions on steel imports. How do you expect the prices of automobiles and office towers to be affected? U.S. steelmakers seek...
-
Jack needs $300,000 for a luxury car. Jack currently has $18,130 to invest. He has found a mutual fund with an expected annual return of 7.5% in which he will place the money. How long will it take...
-
What is the current yield on this bond, based on the closing price? Bond is HWL 8 1/2 28 Vol is 125,400 close is 67.75 net change is +7
-
What is the age of the oldest known caldera associated with the Yellowstone hotspot?

Study smarter with the SolutionInn App


