

Figure 1 shows a short-run Phillips curve and a long-run Phillips curve. 1. Identify the curves and
Question:
Figure 1 shows a short-run Phillips curve and a long-run Phillips curve.
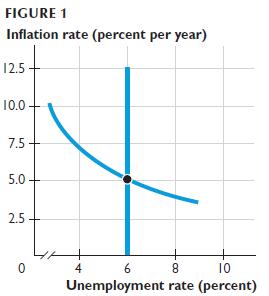
1. Identify the curves and label them. What is the expected inflation rate and what is the natural unemployment rate?
2. If the expected inflation rate increases to 7.5 percent a year, show the new short-run and long-run Phillips curves.
3. If the natural unemployment rate increases to 8 percent, show the new short-run and long-run Phillips curves.
4. If aggregate demand starts to grow more rapidly and the inflation rate eventually hits 10 percent a year, how do unemployment and inflation change?
Fantastic news! We've Found the answer you've been seeking!
Step by Step Answer:
1 The longrun Phillips curve is the vertical curve LRPC and the shortrun Phil...View the full answer

Answered By
Brown Arianne
Detail-oriented professional tutor with a solid 10 years of experience instilling confidence in high school and college students. Dedicated to empowering all students with constructive feedback and practical test-taking strategies. Effective educator and team player whether working in a school, university, or private provider setting. Active listener committed to helping students overcome academic challenges to reach personal goals.
2+ Reviews
10+ Question Solved
Related Book For 

Question Posted:
