

In a year, 130,000 aircraft mechanics and service technicians earned an average of $20 an hour whereas
Question:
In a year, 130,000 aircraft mechanics and service technicians earned an average of $20 an hour whereas 30,000 elevator installers and repairers earned an average of $25 an hour. The skill and training for these two jobs are very similar.
Draw the demand and supply curves for these two types of labor. What feature of your graph accounts for the differences in the two wage rates and what feature accounts for the differences in the quantities employed of these two types of labor?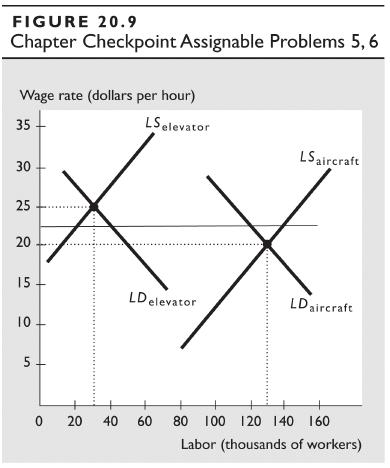
Fantastic news! We've Found the answer you've been seeking!
Step by Step Answer:
Figure 209 shows the labor markets for aircraft mechanics and elevator installers The wage rate paid ...View the full answer

Answered By
Utsab mitra
I have the expertise to deliver these subjects to college and higher-level students. The services would involve only solving assignments, homework help, and others.
I have experience in delivering these subjects for the last 6 years on a freelancing basis in different companies around the globe. I am CMA certified and CGMA UK. I have professional experience of 18 years in the industry involved in the manufacturing company and IT implementation experience of over 12 years.
I have delivered this help to students effortlessly, which is essential to give the students a good grade in their studies.
2+ Reviews
10+ Question Solved
Related Book For 

Question Posted:
