

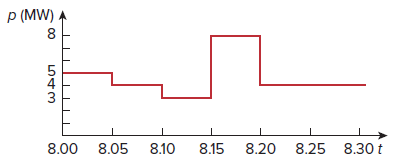
The graph in Fig. 1.33 represents the power drawn by an industrial plant between 8:00 and 8:30
Question:
Fantastic news! We've Found the answer you've been seeking!
Step by Step Answer:
Energy 5 x ...View the full answer

Answered By
Muhammad Umair
I have done job as Embedded System Engineer for just four months but after it i have decided to open my own lab and to work on projects that i can launch my own product in market. I work on different softwares like Proteus, Mikroc to program Embedded Systems. My basic work is on Embedded Systems. I have skills in Autocad, Proteus, C++, C programming and i love to share these skills to other to enhance my knowledge too.
1+ Reviews
10+ Question Solved
Related Book For 
Fundamentals of Electric Circuits
ISBN: 978-0078028229
6th edition
Authors: Charles K Alexander, Matthew Sadiku
Question Posted:
