

How do the results from Problem 13.75 compare with the results in Table 13.51? The hormones in
Question:
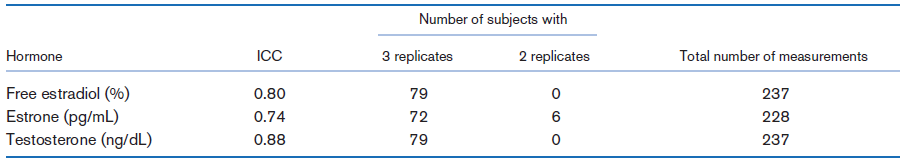
The hormones in Table 13.51 were also included in the reproducibility study mentioned in Example 13.75 [36]. The intraclass correlation coefficient and sample size used for
each hormone are given in Table 13.52.
Table 13.51: Relative-risk estimates and 95% CIs for breast-cancer incidence from 1989 to June 1, 1994, in a nested case€“control study among 11,169 postmenopausal women in the NHS not taking hormone-replacement therapy in 1989, comparing women at the median value of the fourth quartile vs. women at the median value of the first quartile of the hormone distributions
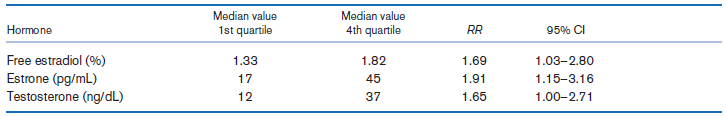
Table 13.52: Intraclass correlation coefficients (ICCs) for selected hormones from the NHS reproducibility study, 1989
Fantastic news! We've Found the answer you've been seeking!
Step by Step Answer:
The measurementerrorcorrected RR estimates are ...View the full answer

Answered By
GERALD KAMAU
non-plagiarism work, timely work and A++ work
6+ Reviews
11+ Question Solved
Related Book For 
Question Posted:
